Transform how you test with Cypress in CI
Cypress Cloud unlocks the full potential of Cypress test automation tools in your CI pipeline. Scale every facet of Cypress testing, and push your code with confidence every time.


Smart Orchestration
Optimize your runs for a faster feedback loop
It can take a long time for tests to complete while running serially on one machine. Increase velocity and shorten feedback loops by parallelizing Cypress test specs across multiple virtual machines in CI.
Learn more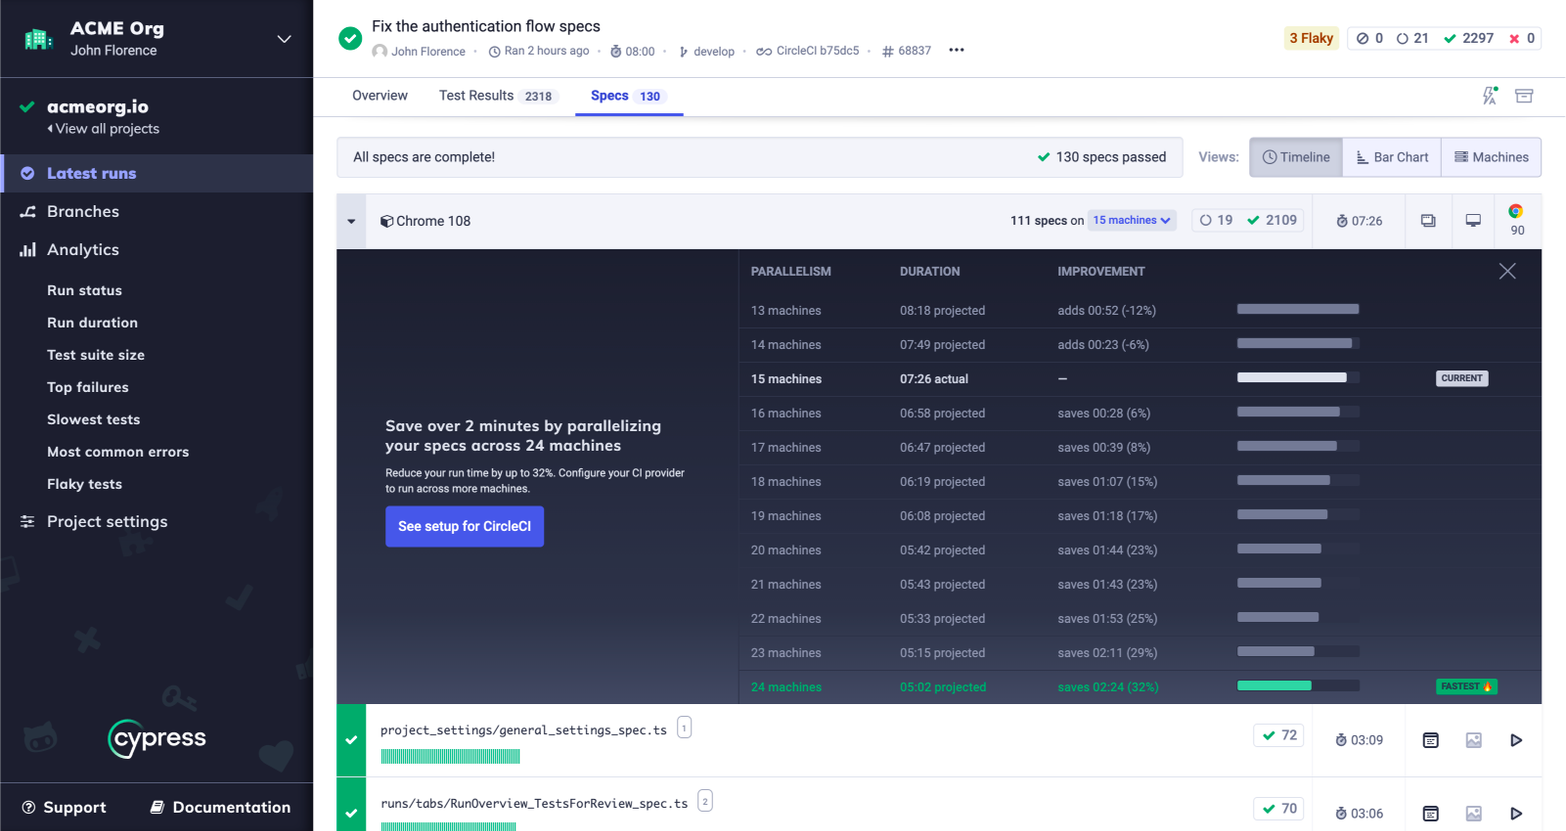
Cypress automatically balances your test specs across the available machines during parallelization. This ensures that your test specs run as fast as possible, with no need for manual configuration.
Learn moreMachine 1Spec.cy.jsSpec.cy.jsMachine 2Spec.cy.jsSpec.cy.jsMachine 3Spec.cy.jsSpec.cy.jsSpec.cy.jsMachine 4Spec.cy.jsSpec.cy.jsSpec.cy.jsSpec.cy.jsMachine 5Spec.cy.jsSpec.cy.jsSpec.cy.jsSpec.cy.jsAccelerate your deployment times and quickly verify that your latest changes fixed a build in CI by automatically prioritizing the test specs that failed in the previous Cypress run.
Learn moreMachine 1Spec.cy.jsSpec.cy.jsMachine 2Spec.cy.jsSpec.cy.jsSpec.cy.jsMachine 3Spec.cy.jsSpec.cy.jsSpec.cy.jsMachine 4Spec.cy.jsSpec.cy.jsMachine 5Spec.cy.jsSpec.cy.jsSpec.cy.jsSpec.cy.jsProtect valuable CI resources by automatically canceling a Cypress run after a configurable numbers of tests fail. Auto Cancellation reduces CI costs and frees-up resources for other team members and builds.
Learn moreMachine 1Spec.cy.jsSpec.cy.jsMachine 2Spec.cy.jsSpec.cy.jsMachine 3Spec.cy.jsSpec.cy.jsSpec.cy.jsMachine 4Spec.cy.jsSpec.cy.jsSpec.cy.jsSpec.cy.jsMachine 5Spec.cy.jsSpec.cy.jsSpec.cy.jsSpec.cy.js
Visual Reviews
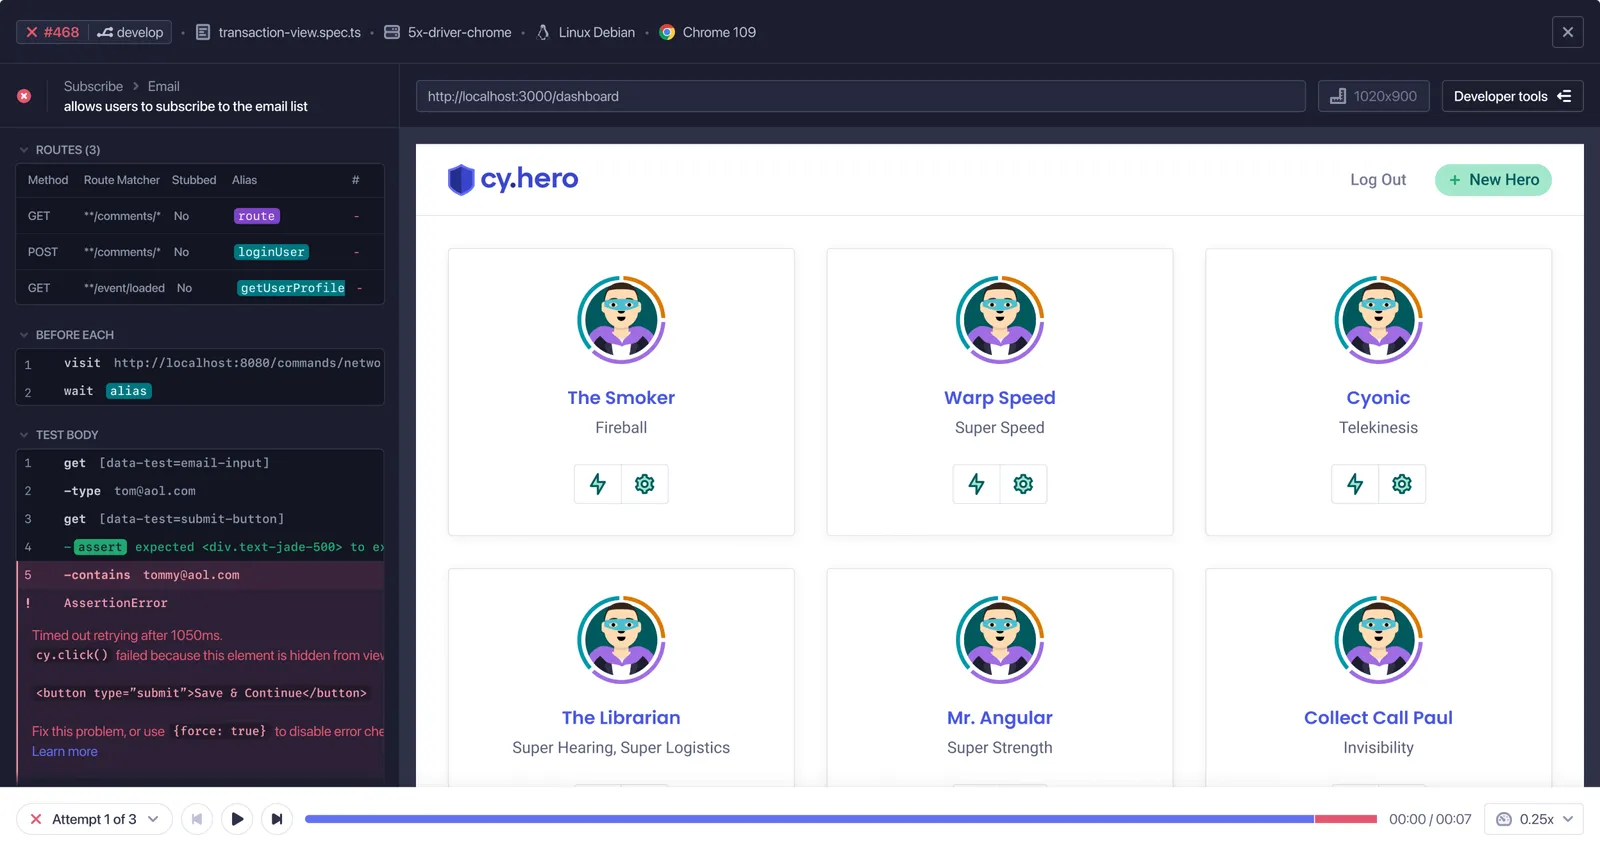
Review and debug failures visually
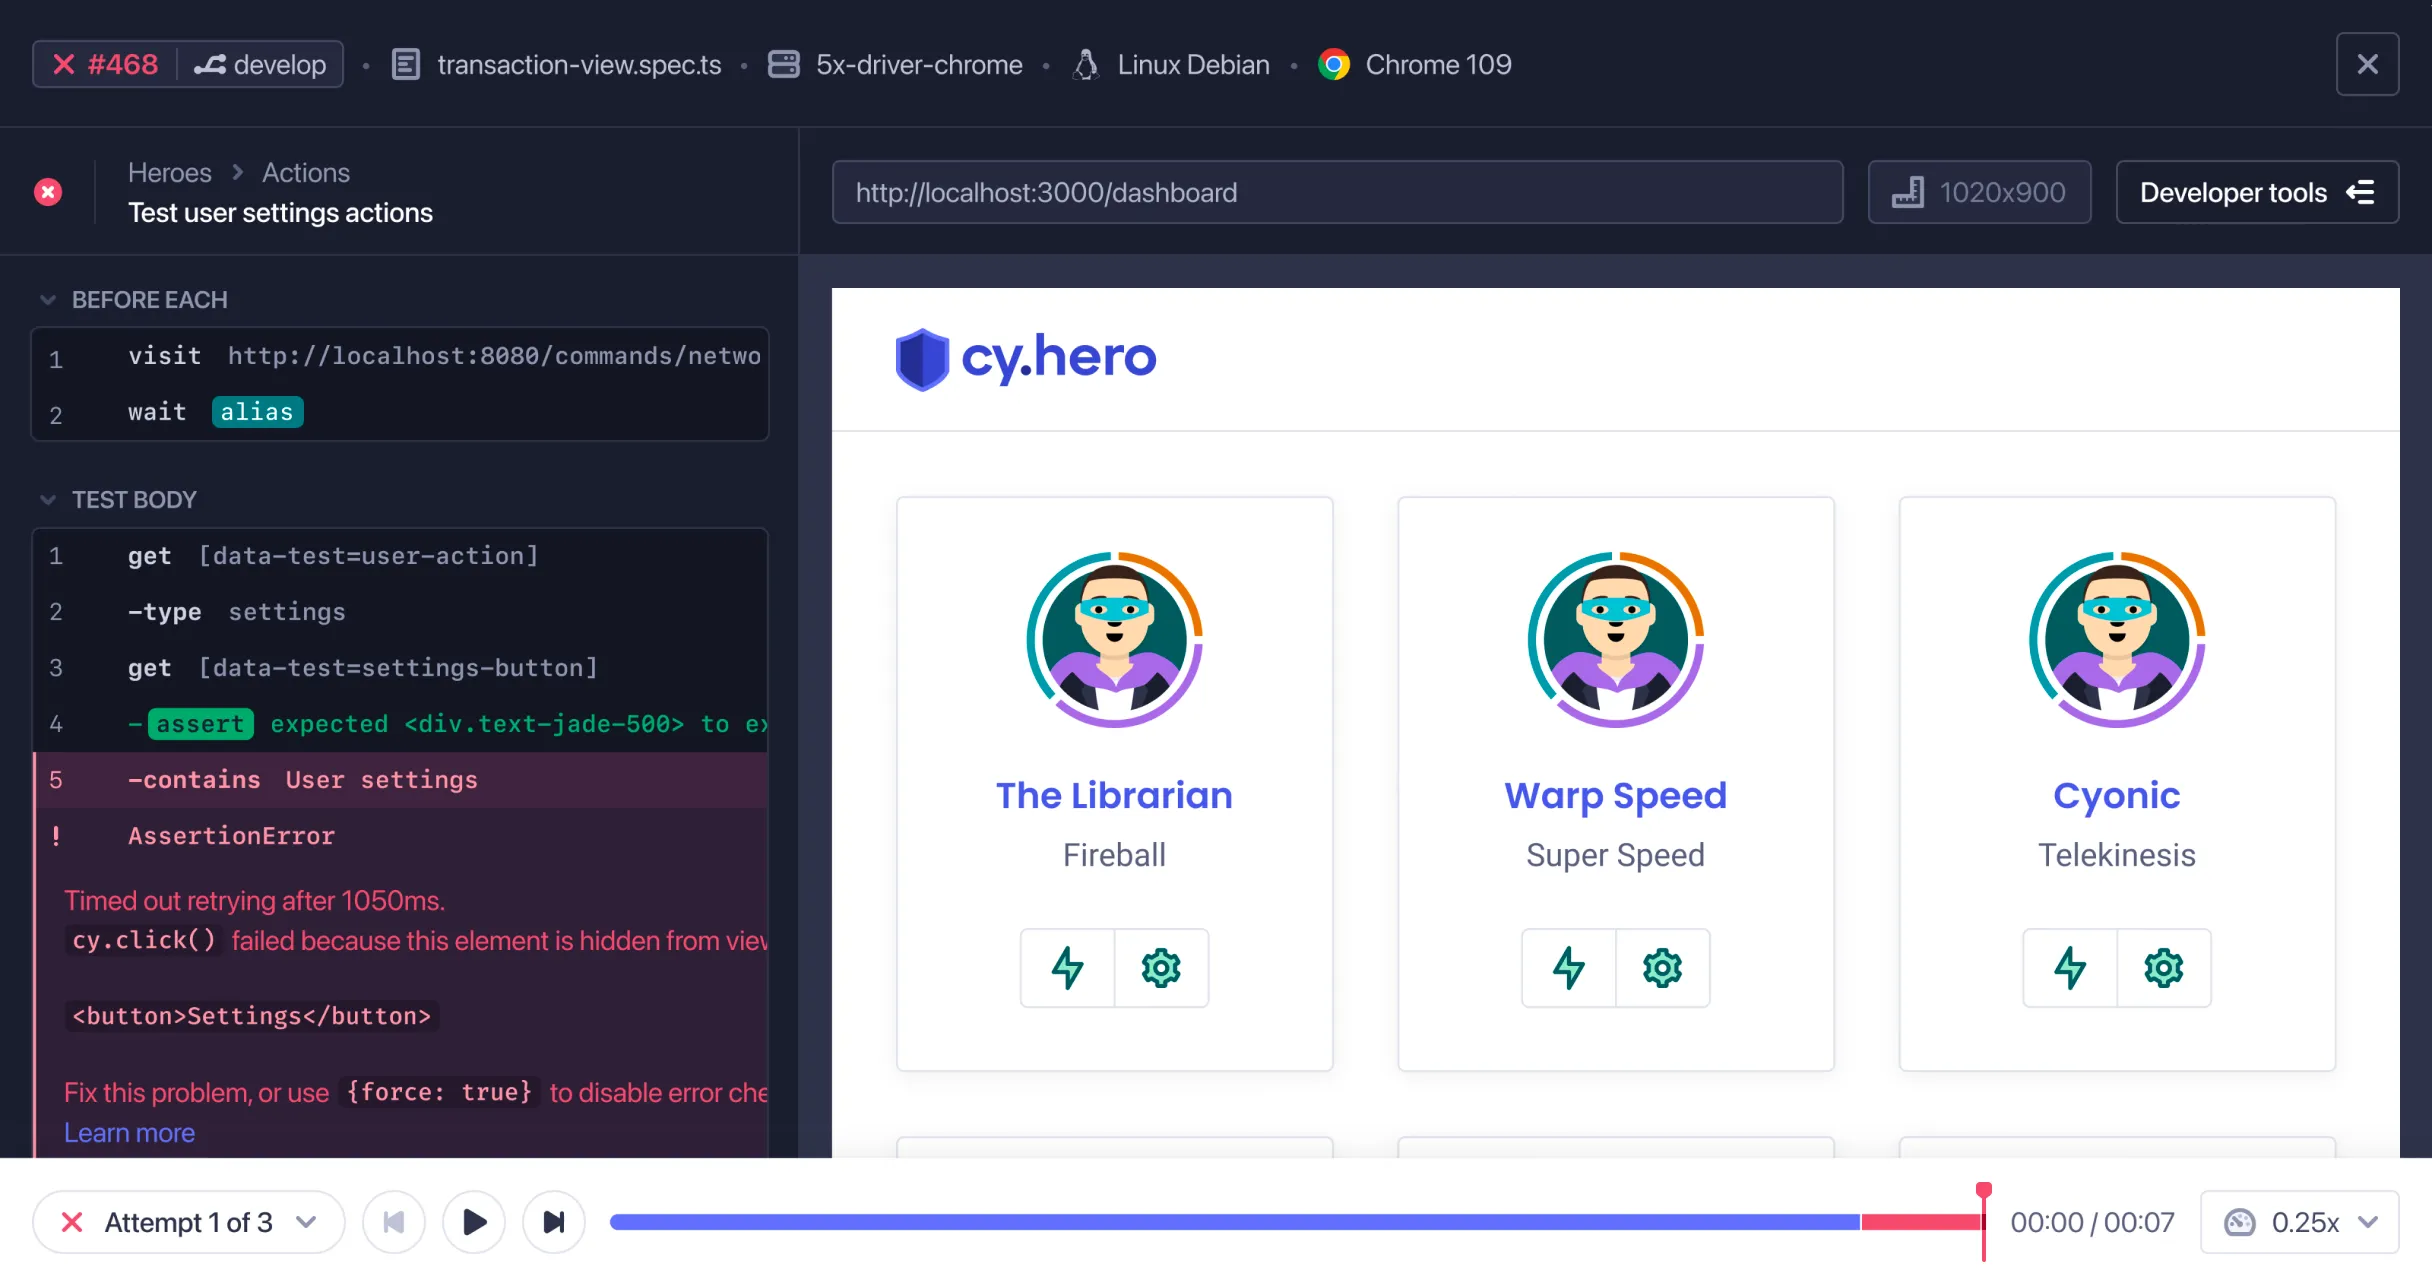
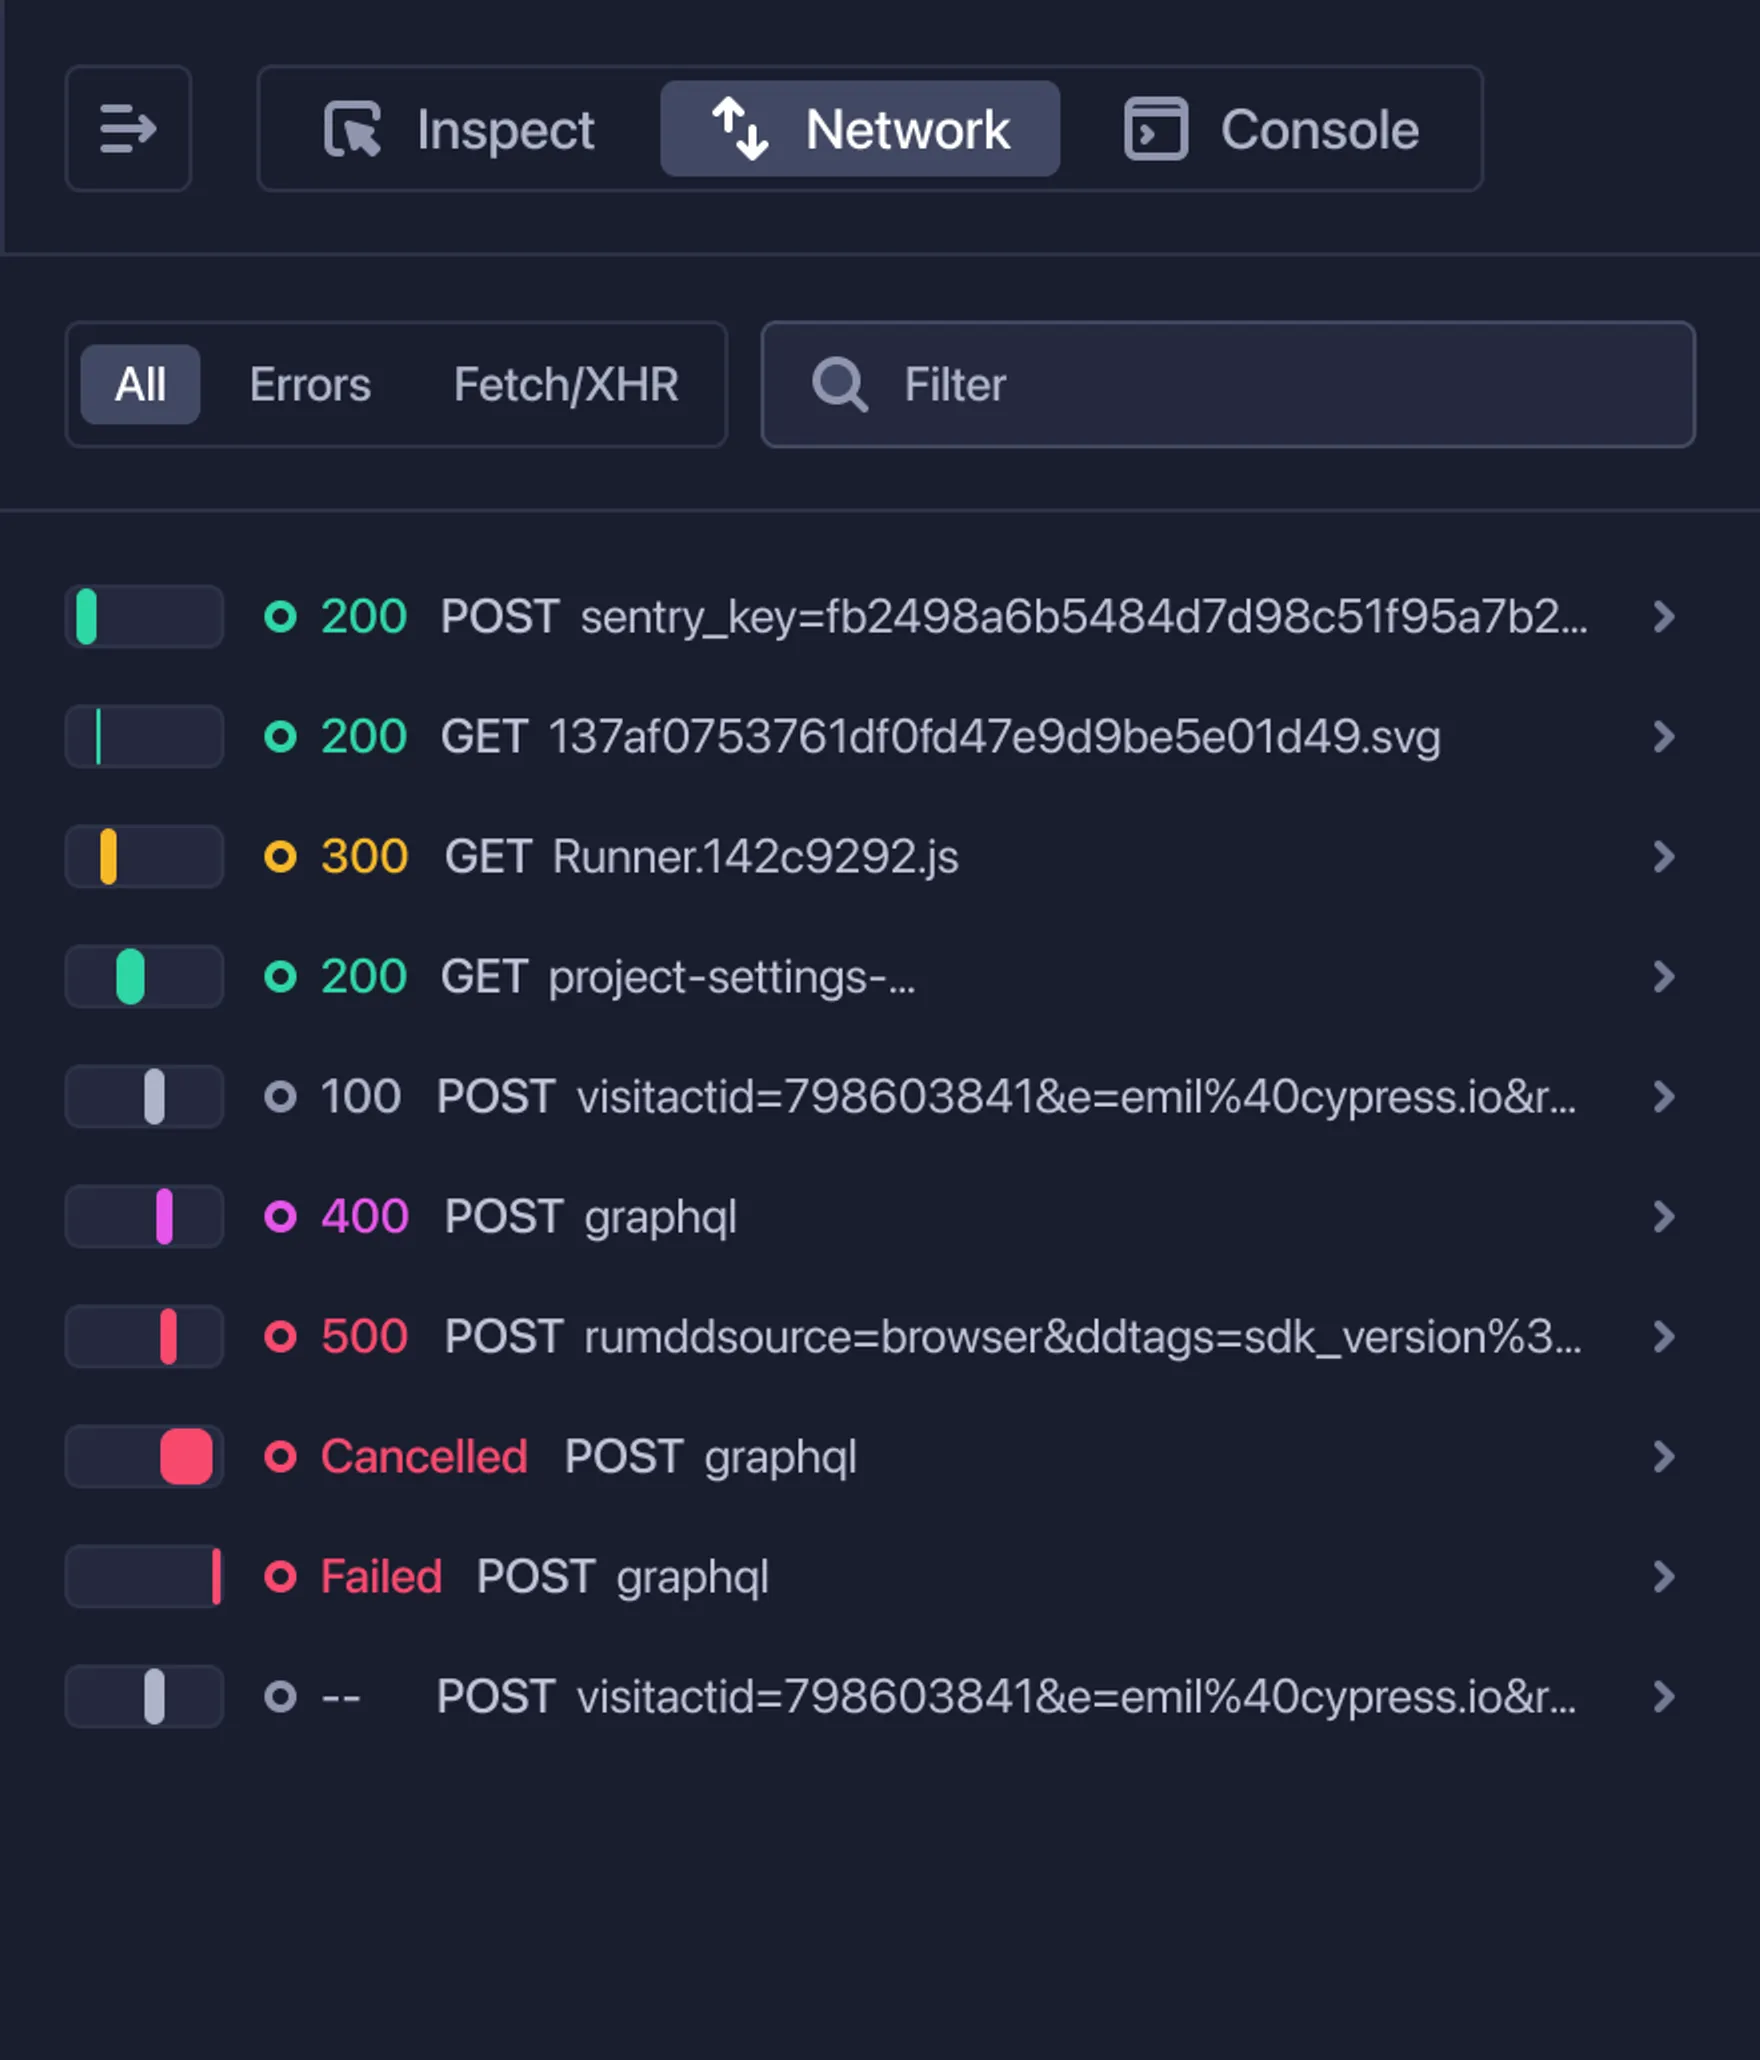
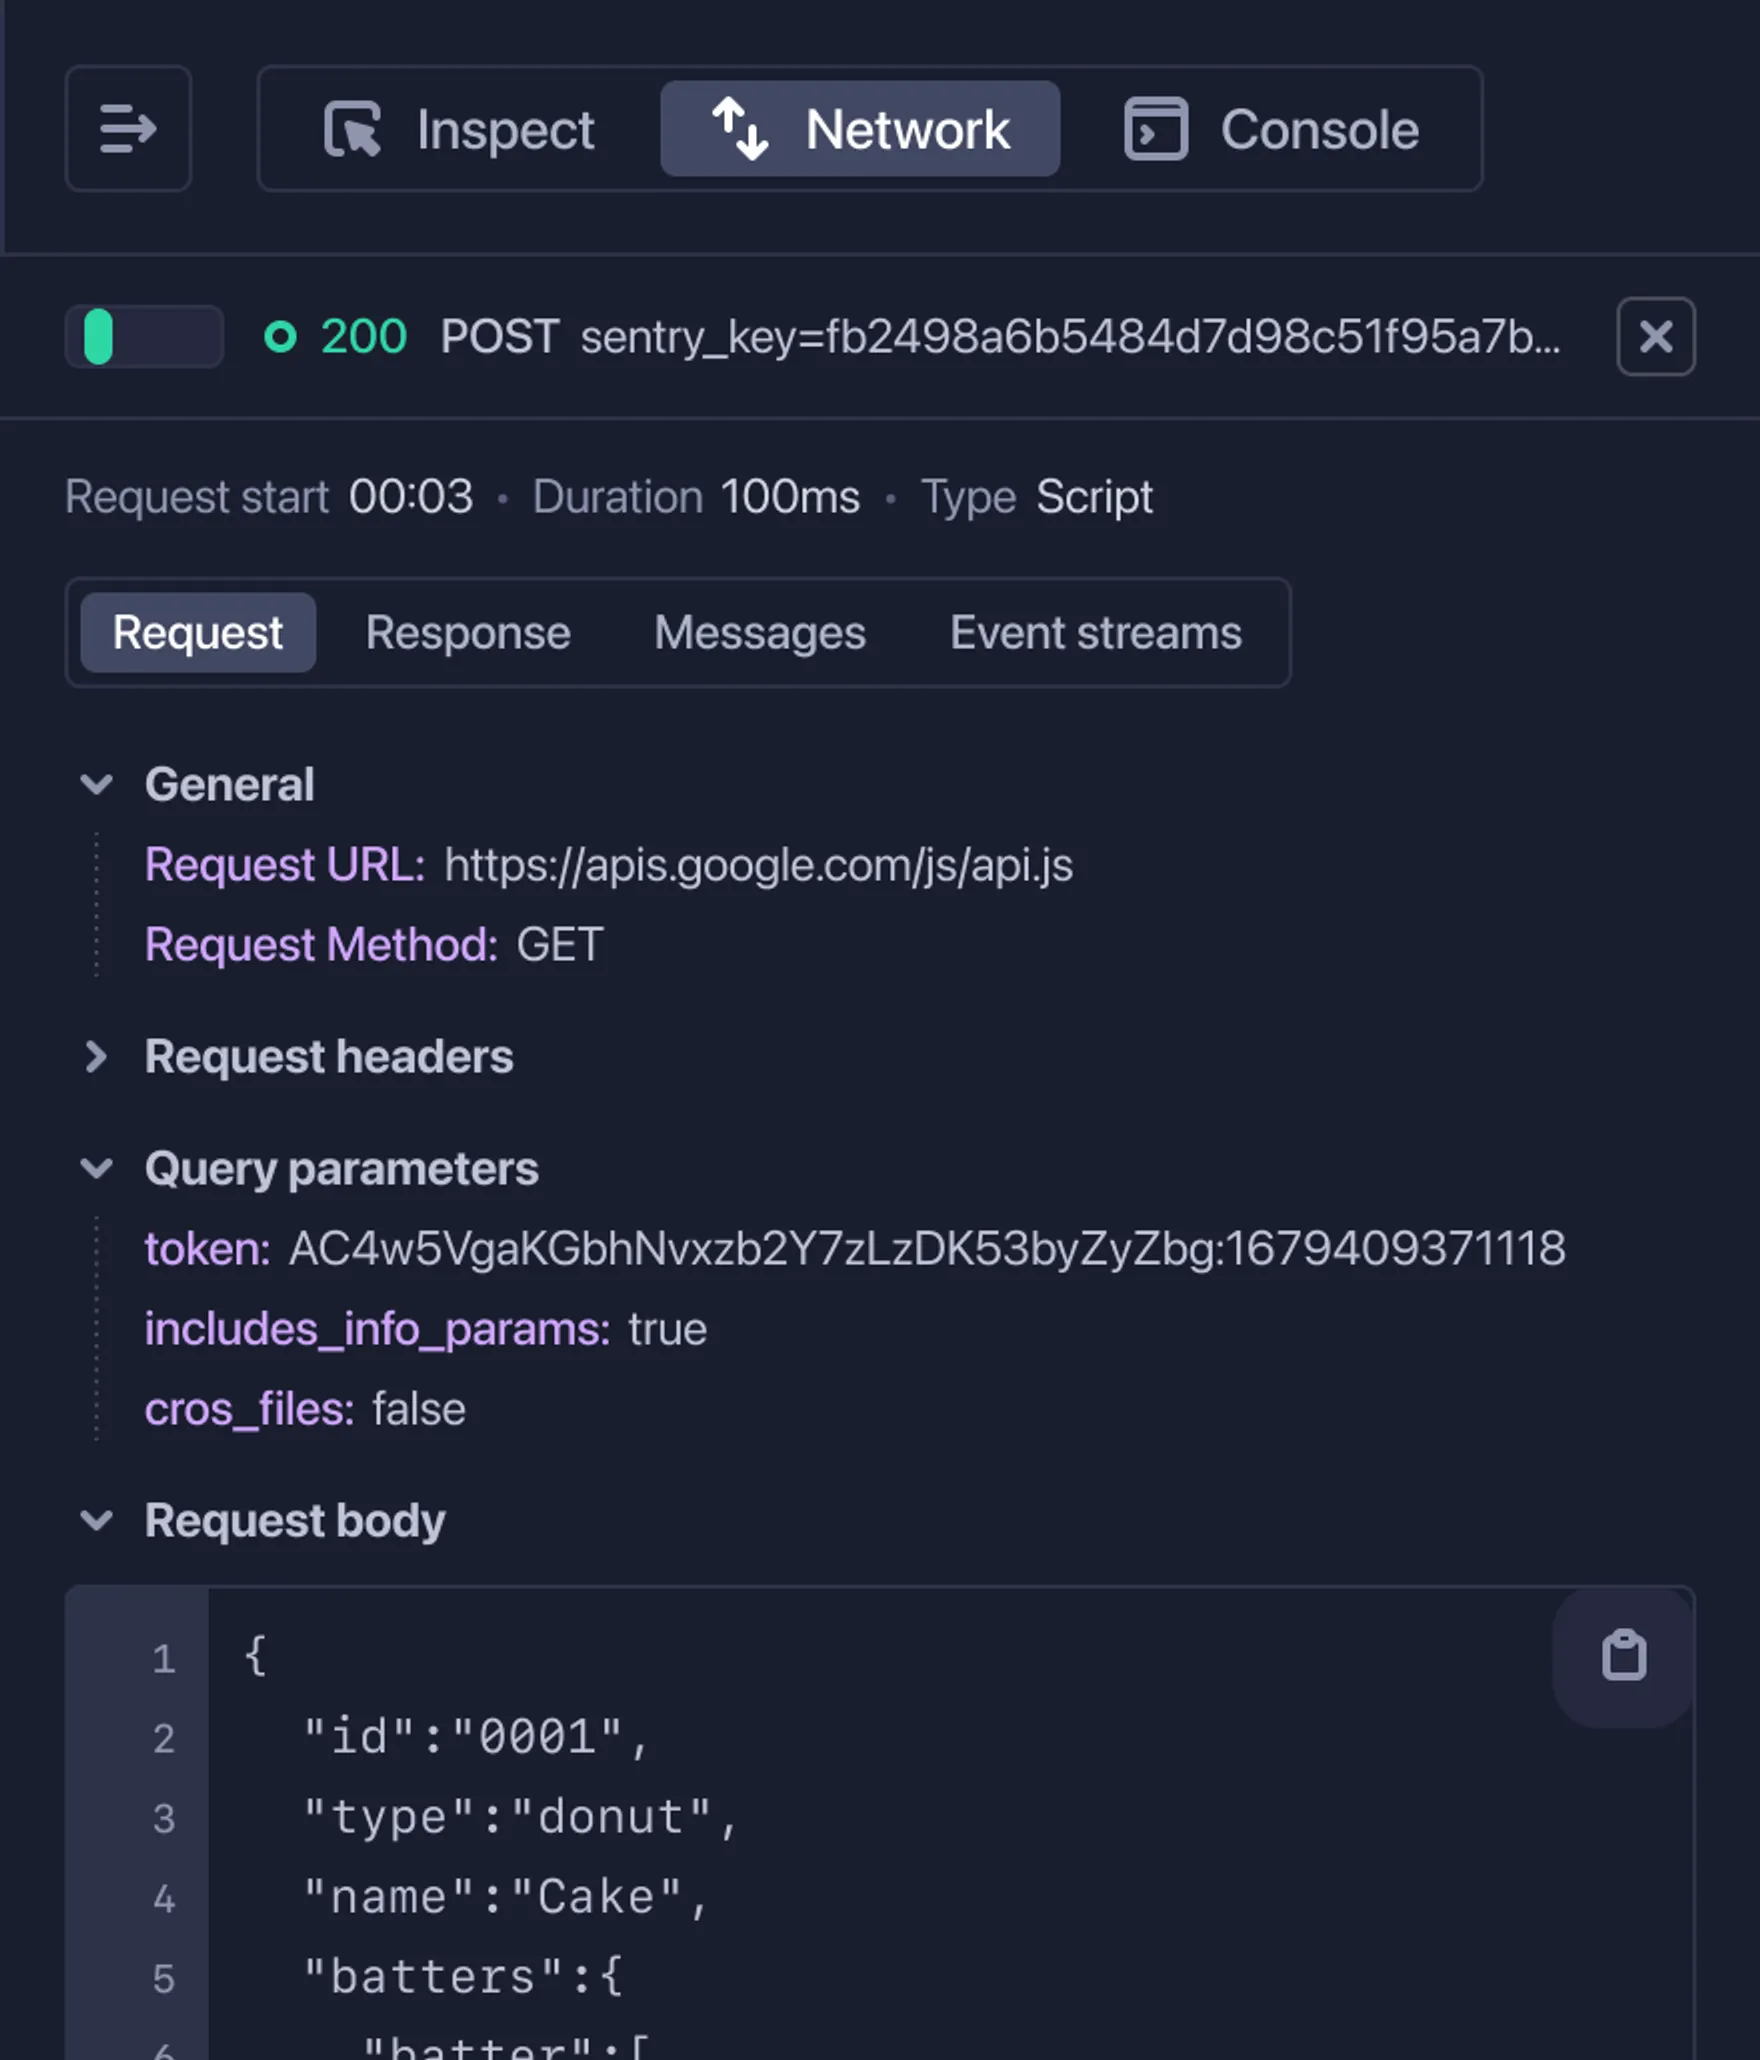
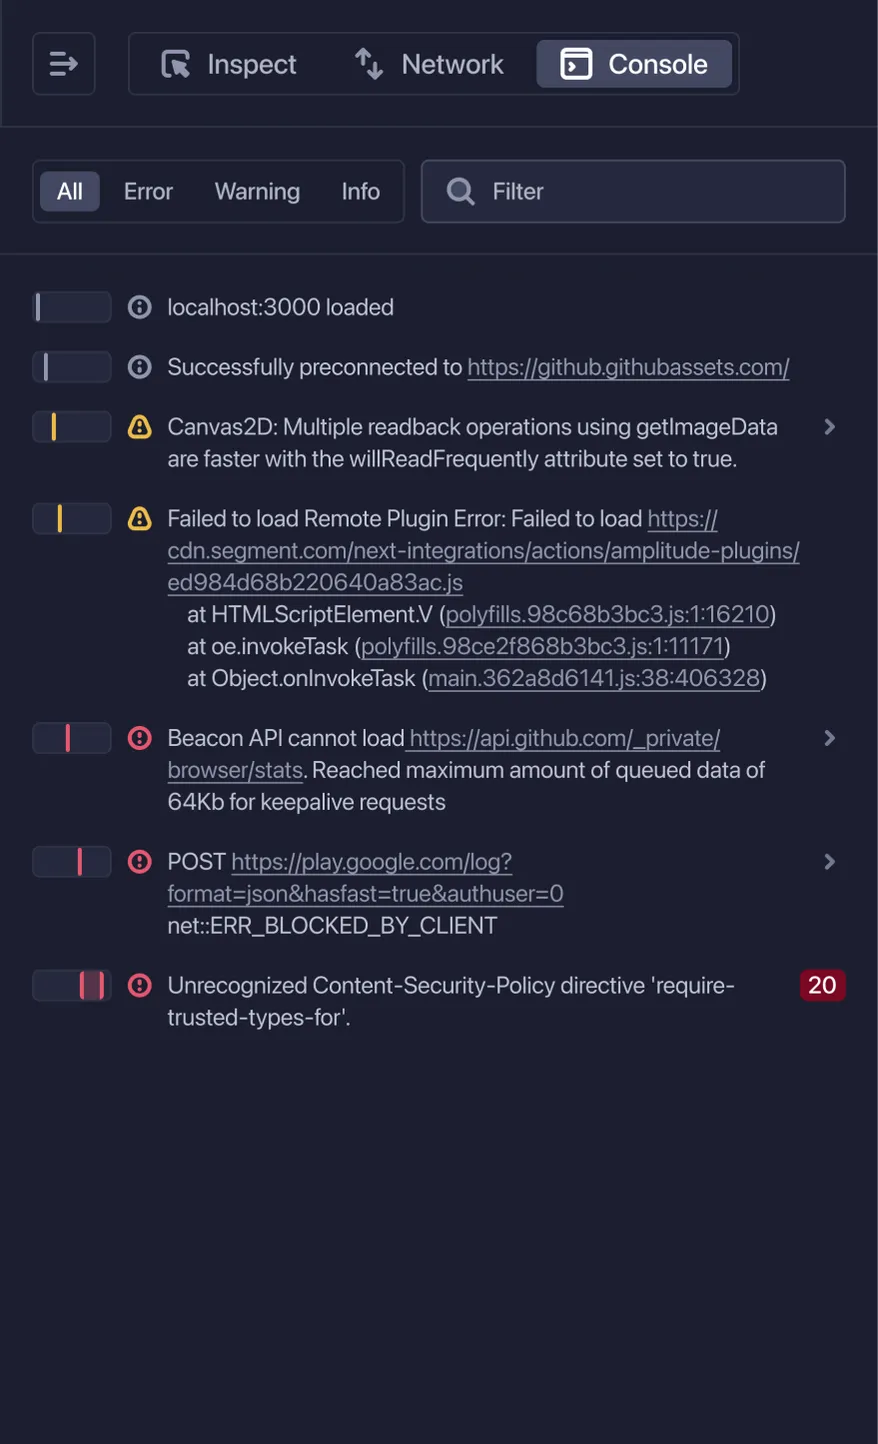
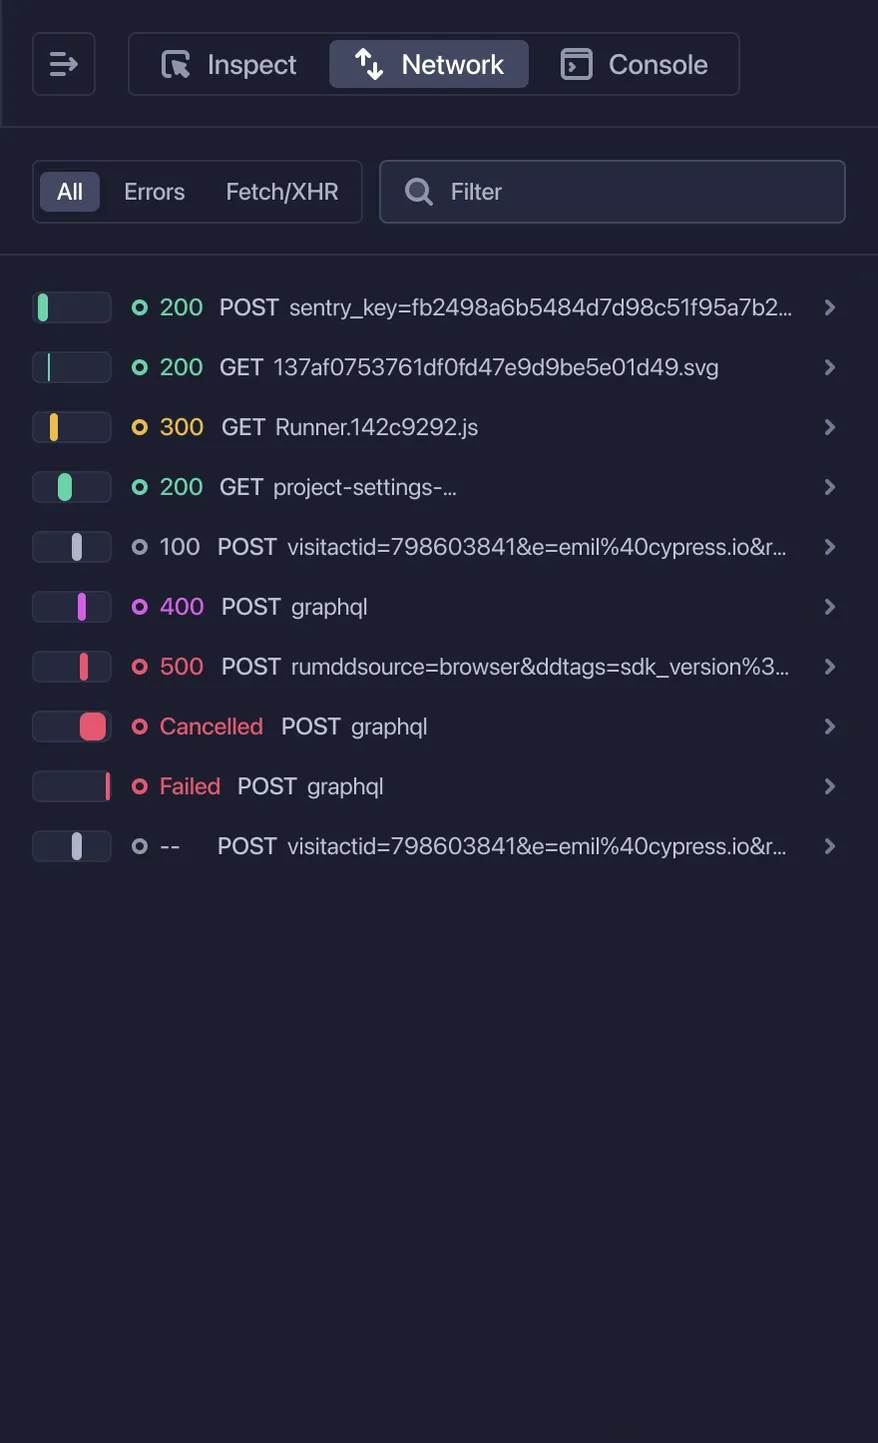
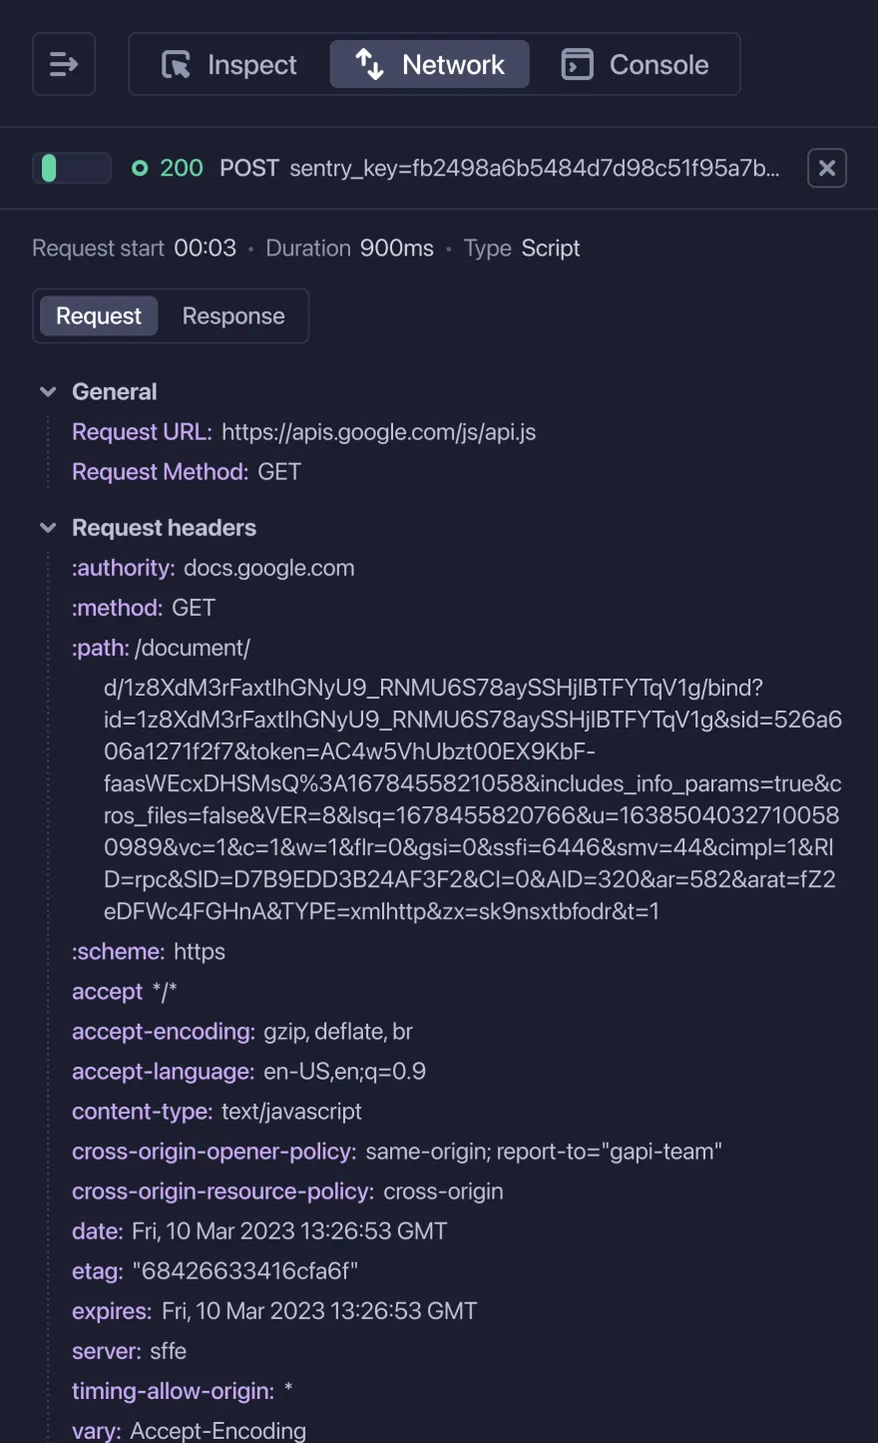
Wind back the clock to any point in an application's execution and see exactly what it was doing during the point of failure. Inspect the DOM, network events, and console logs of your application from your tests exactly as they ran in CI.
Learn more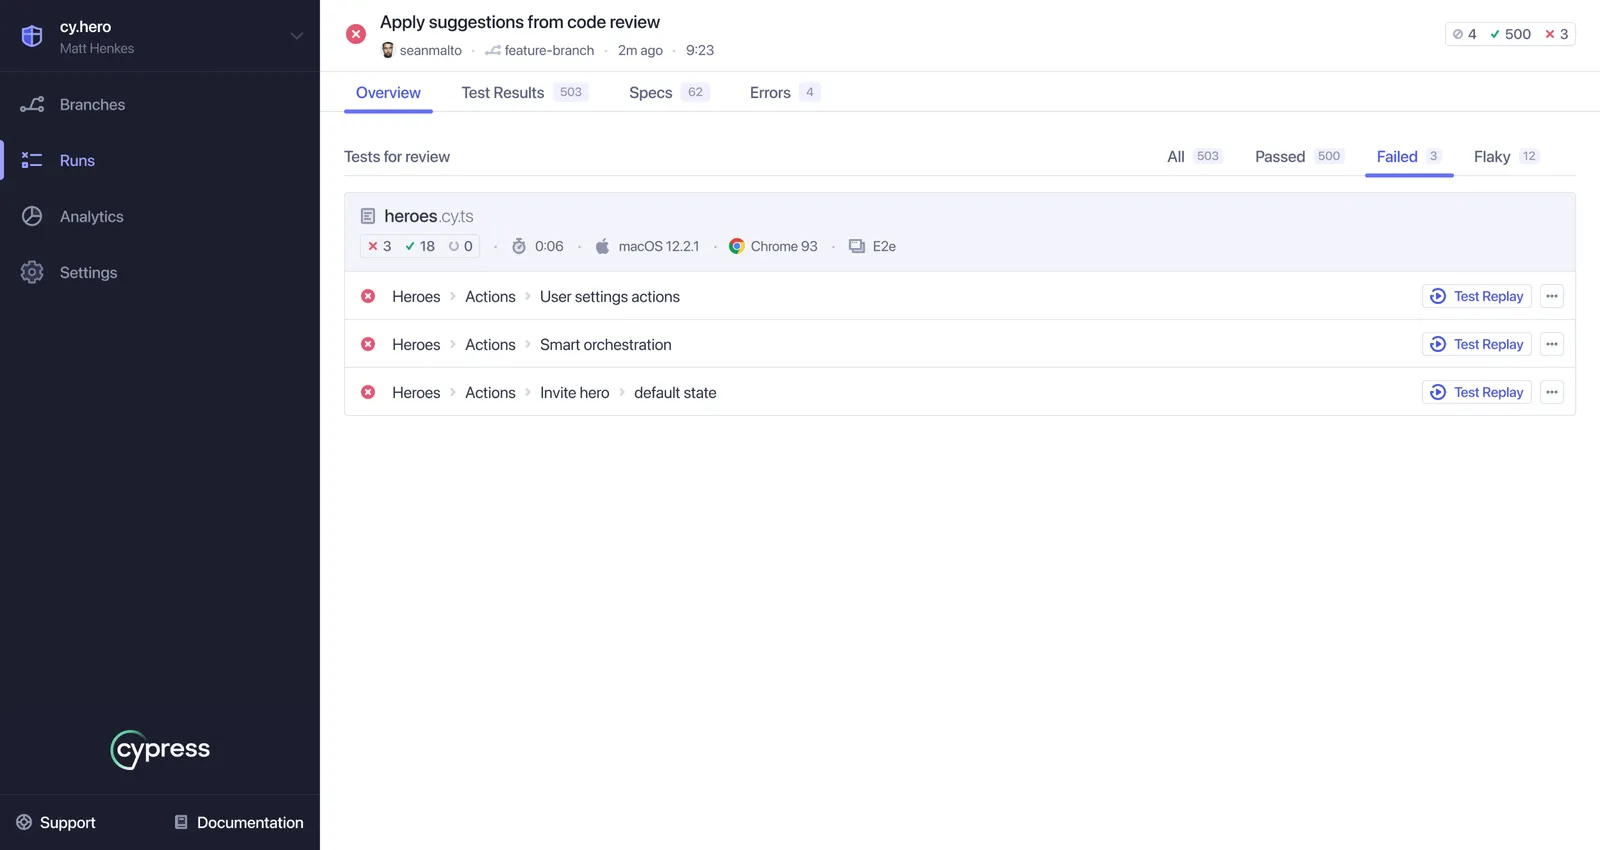
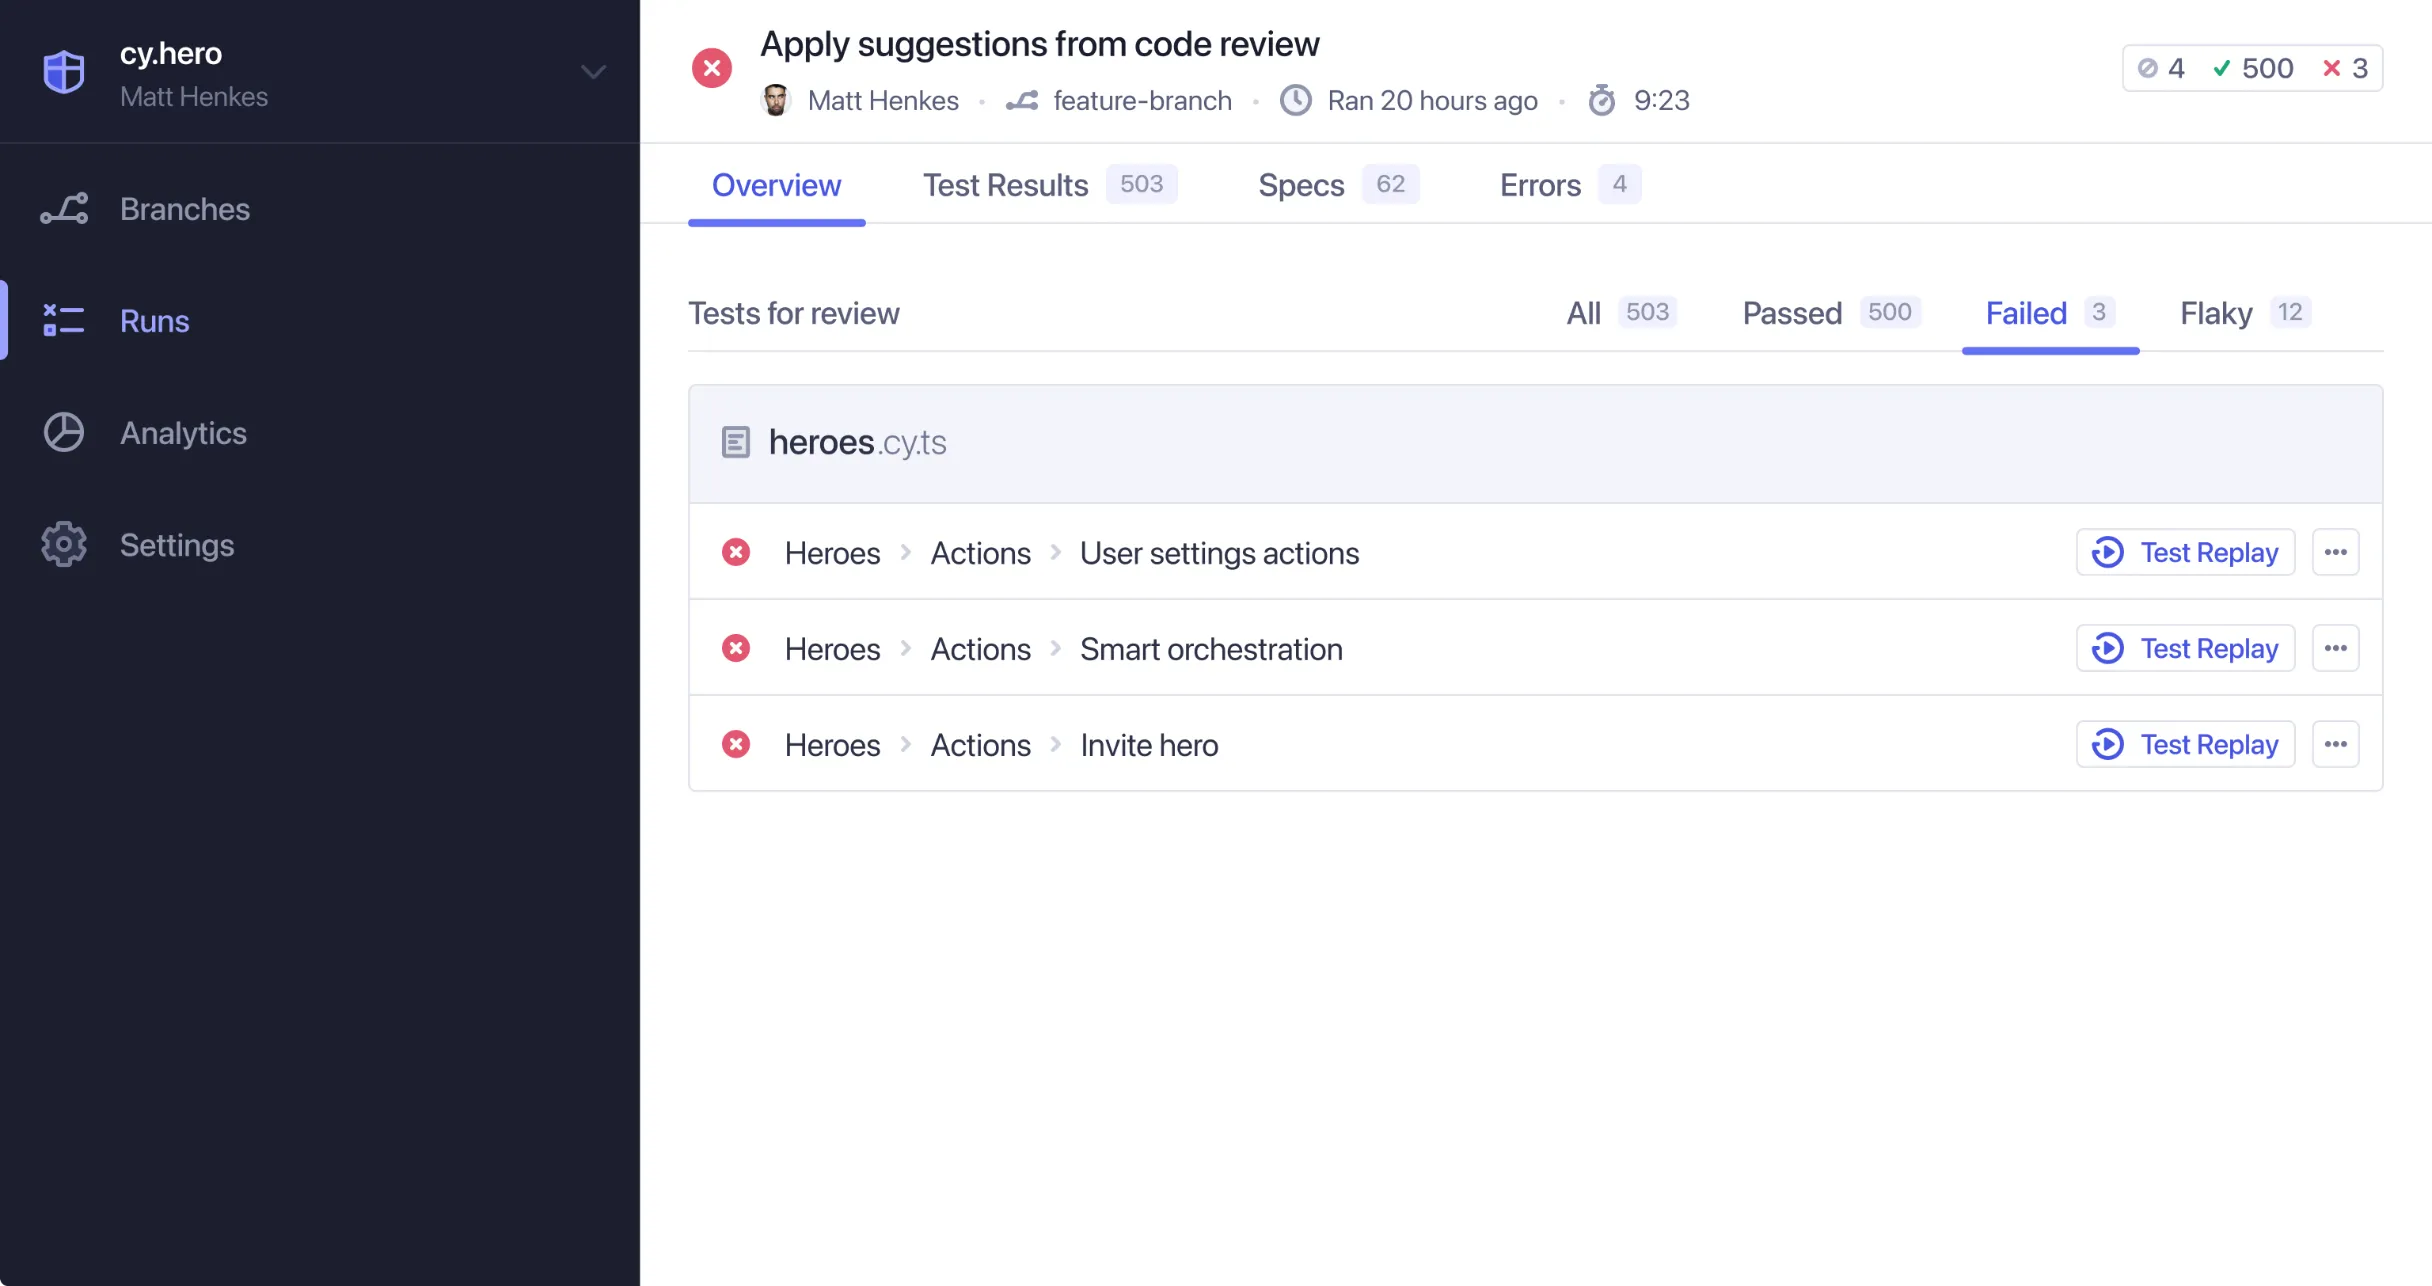
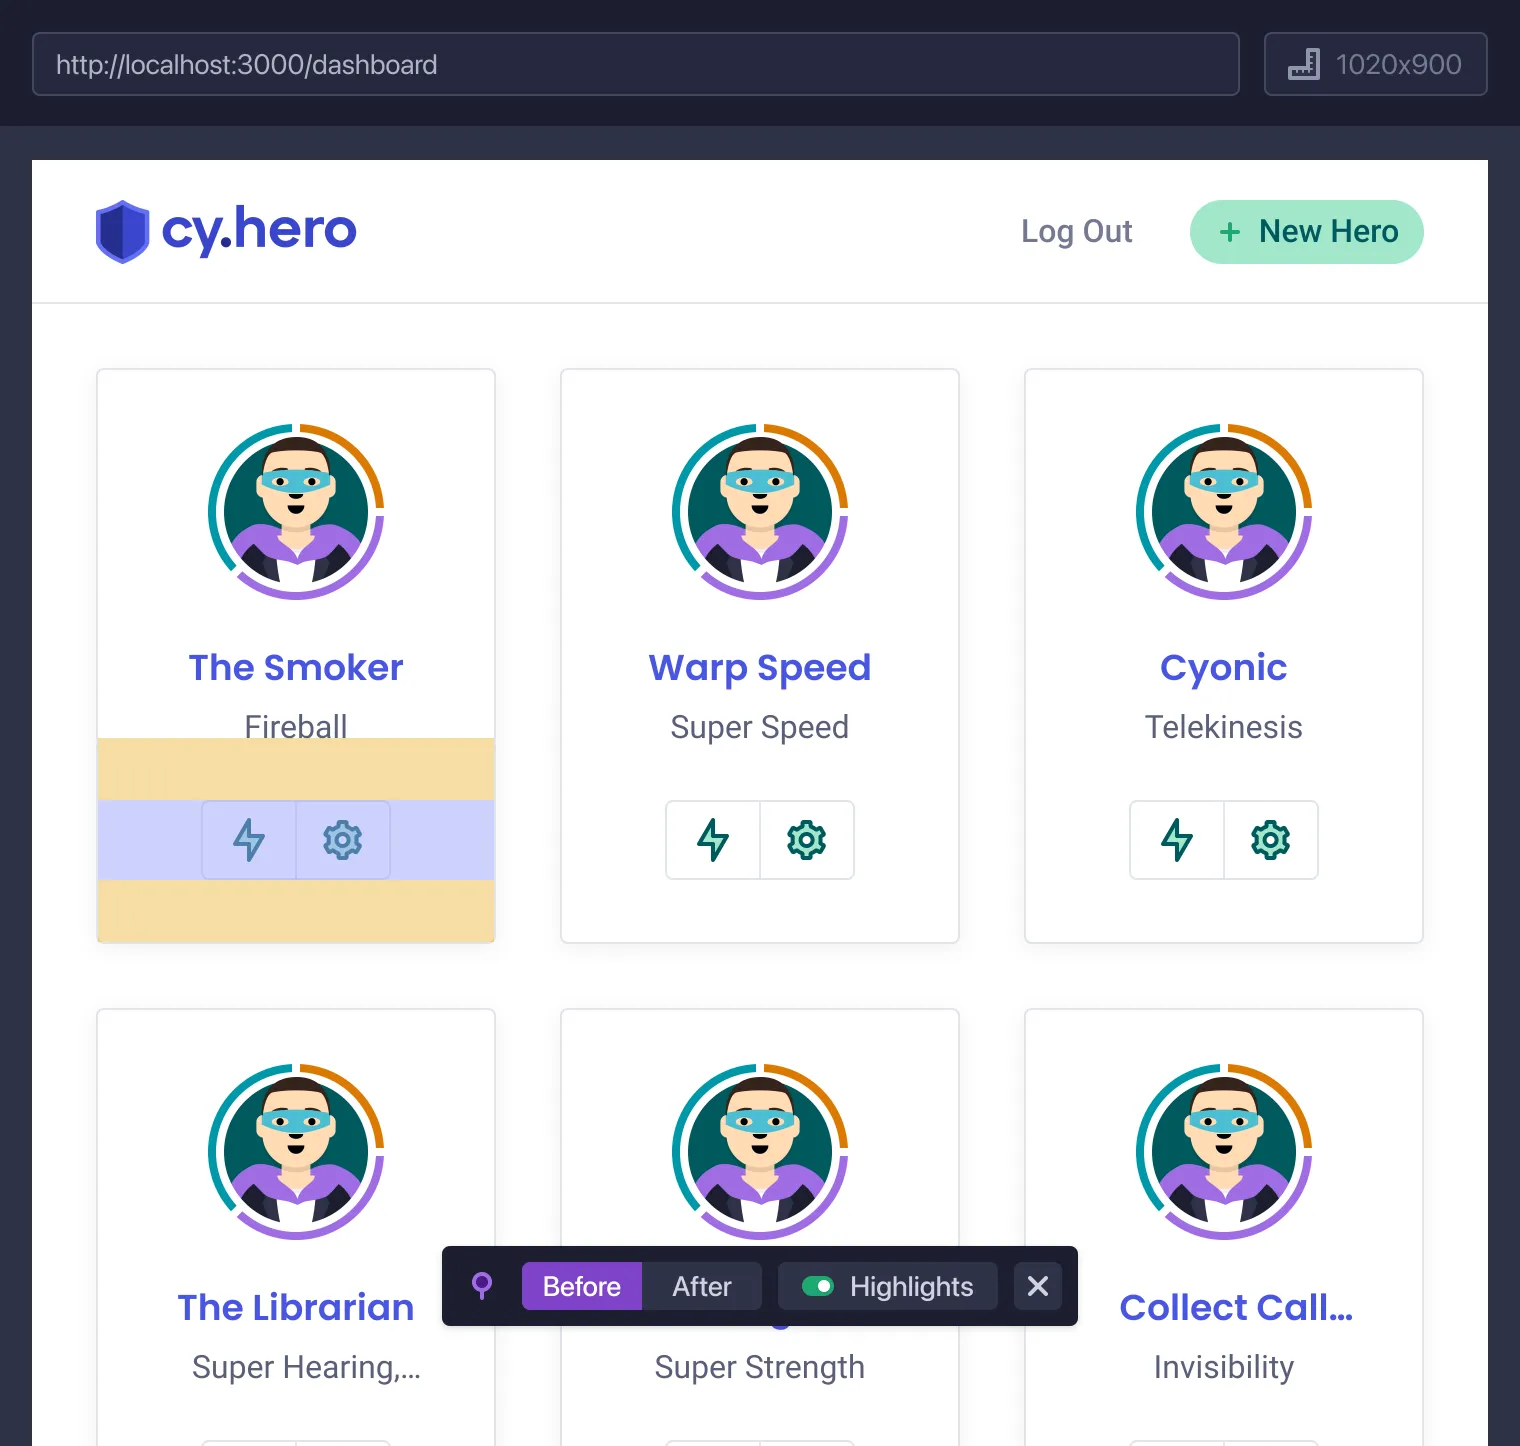
Understand whether you've introduced or resolved failed, flaky, or pending tests. Analyze the impact of your branch's latest pull request by reviewing the before-and-after of test suite changes side-by-side.
Learn more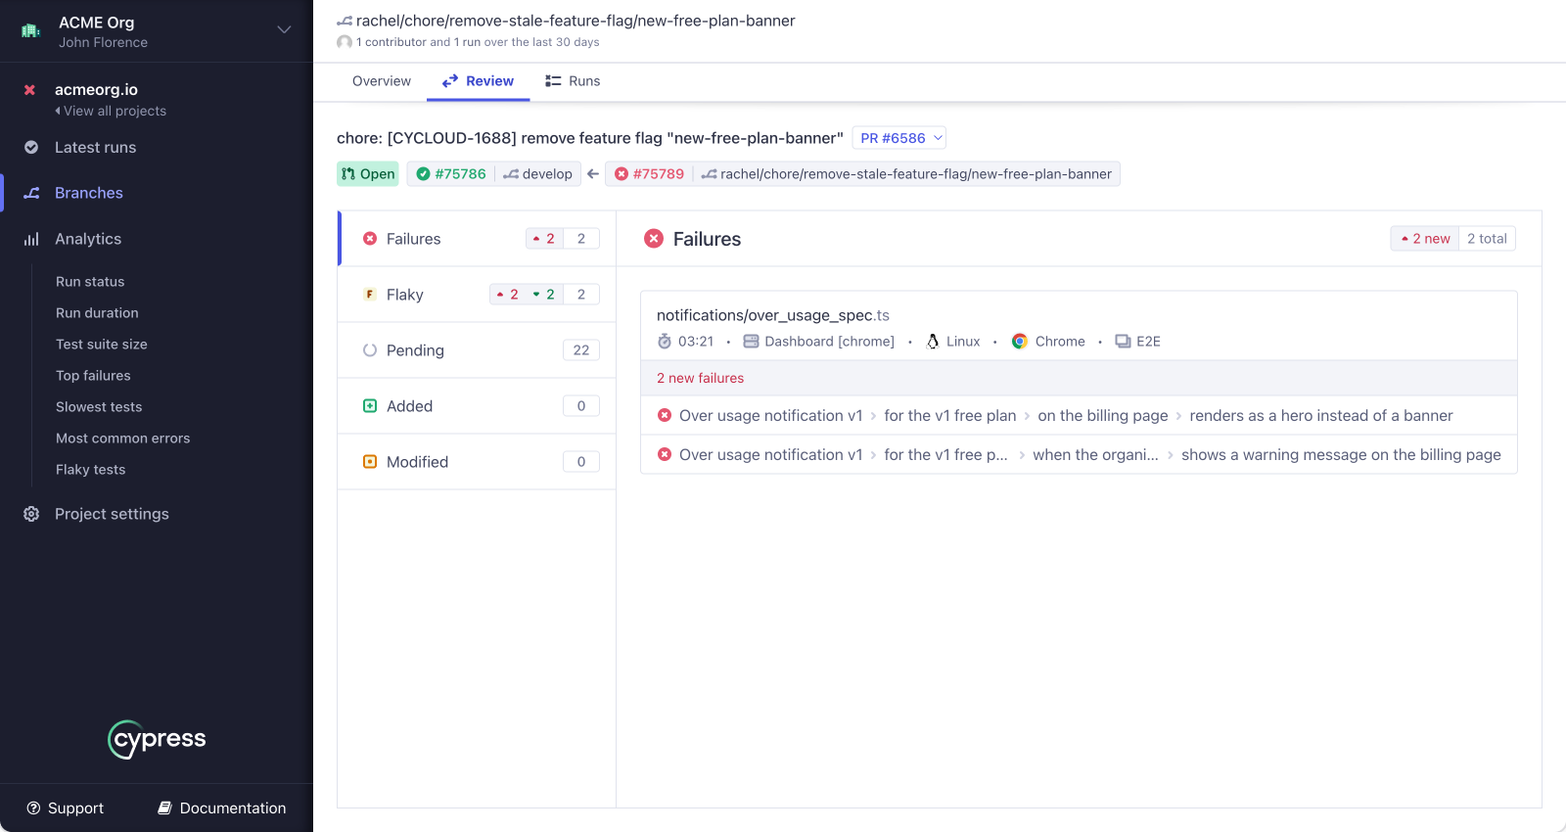
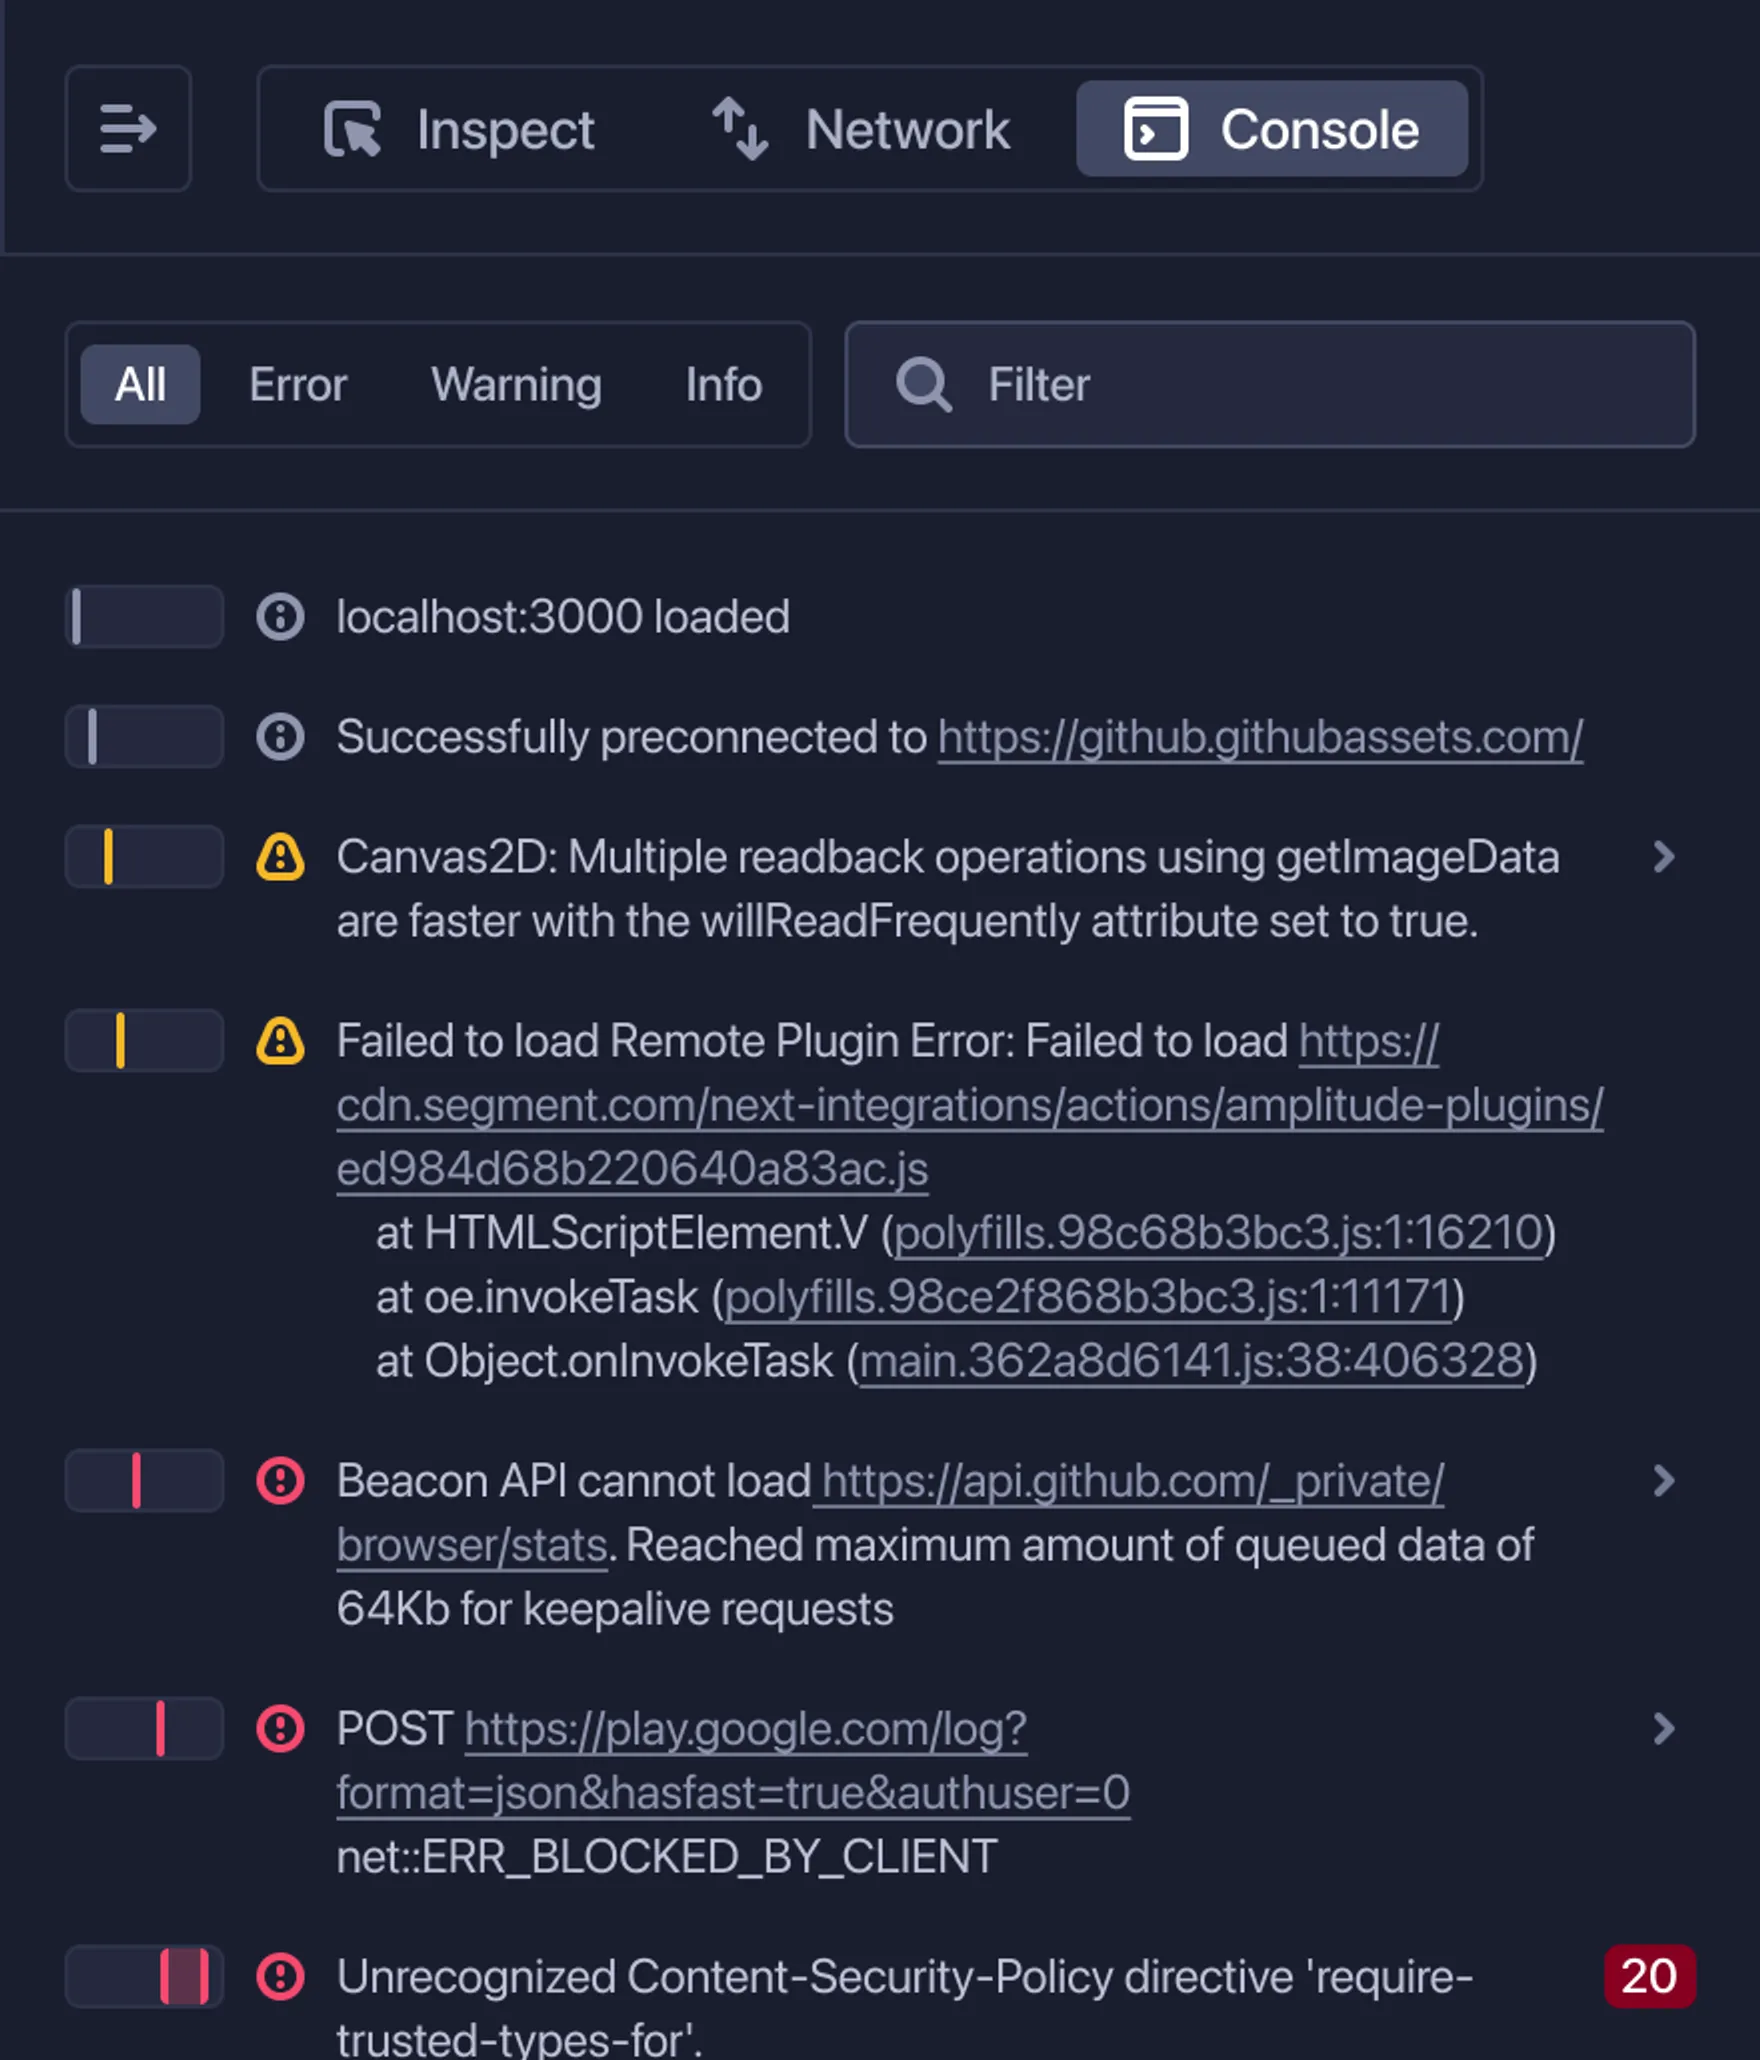
Every test run error is captured, grouped, and accompanied by a detailed stack trace output that gives you the information you need to identify the exact point of failure in your application.
Learn more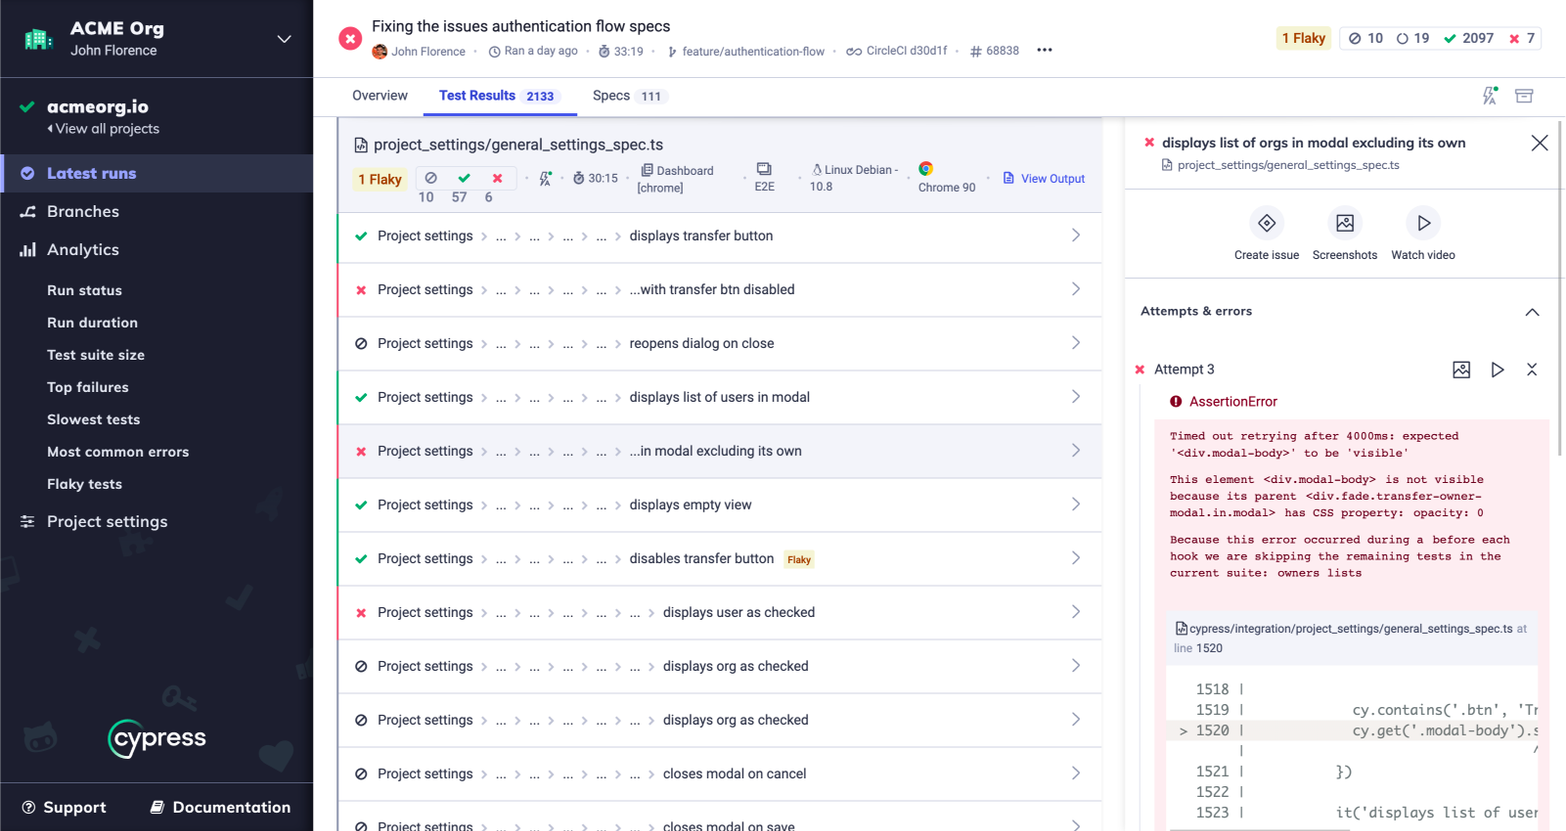
When a flaky test run is detected in CI, Cypress automatically flags the test run with the number of times it flaked in recorded history. Uncover previous flake occurrences and pinpoint when it was first detected.
Learn more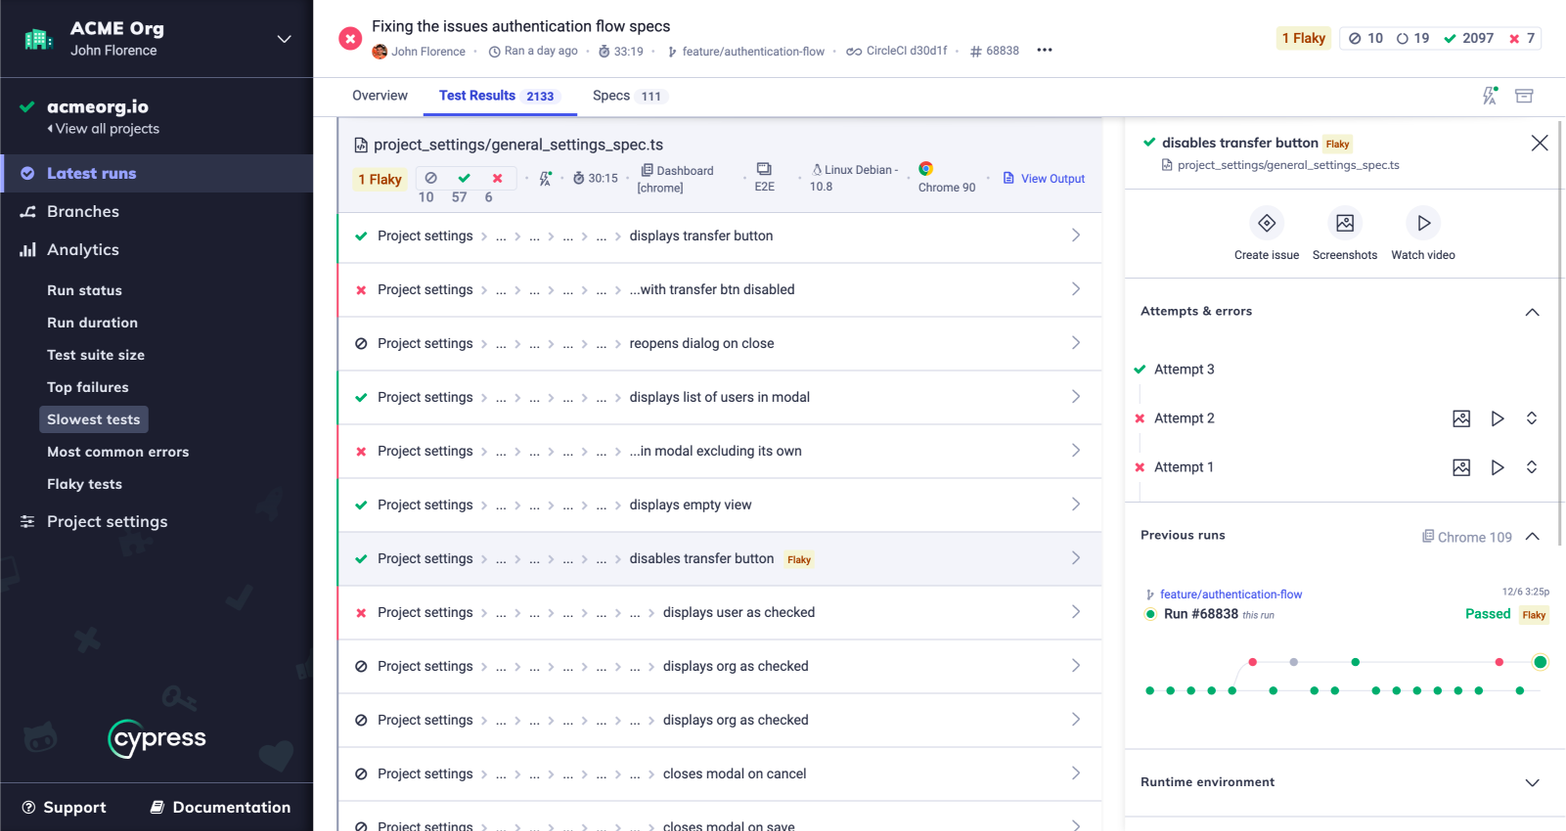
Identify important changes that impact your test runs’ success and performance in CI. Analyze previous test failure rates, test definition changes, run durations, and flake occurrences with complete test history.
Learn more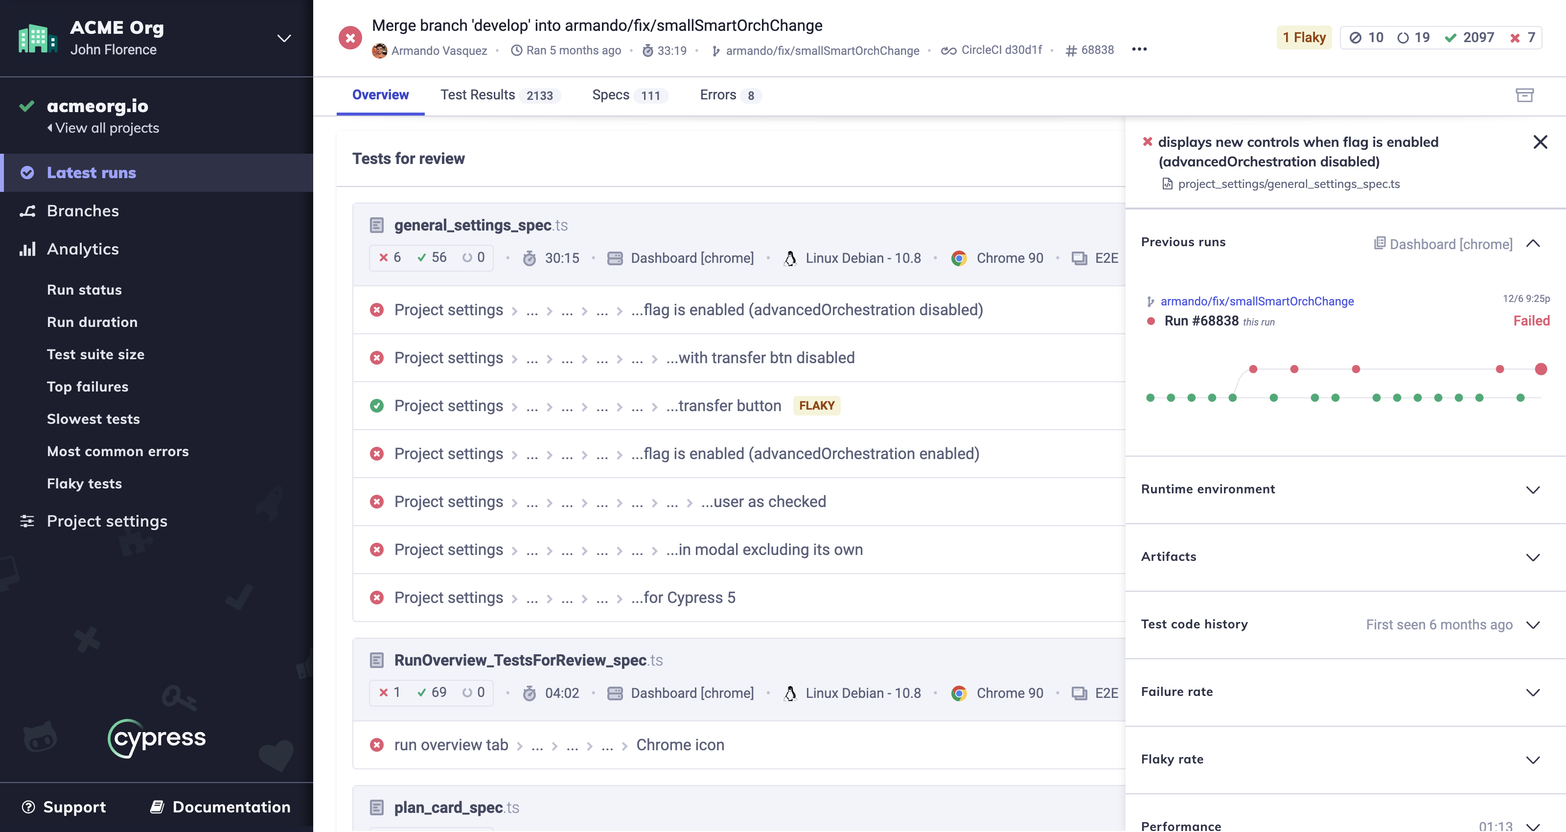

Test Analytics
Gain actionable insights into your test suite
Explore the performance of each test run and track how your project’s health changes over time. Cypress detects updates to your test run’s configuration so you can pinpoint when impactful changes occur.
Learn more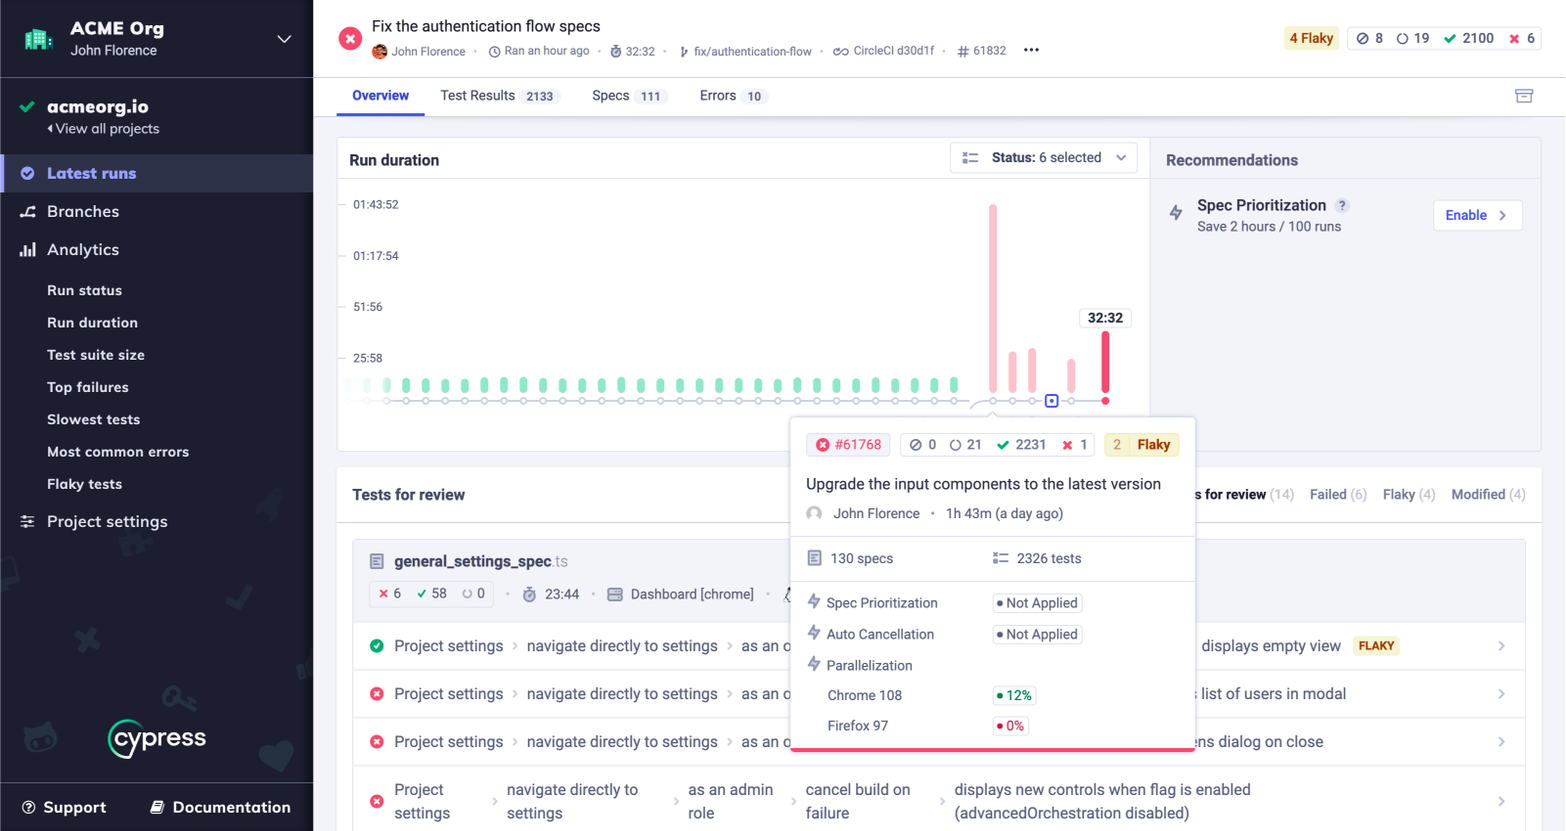
Ensure adequate test code coverage by tracking your total test suite size and runs over time. You can even filter by branch to fully understand which areas of your application might benefit from more test coverage.
Learn more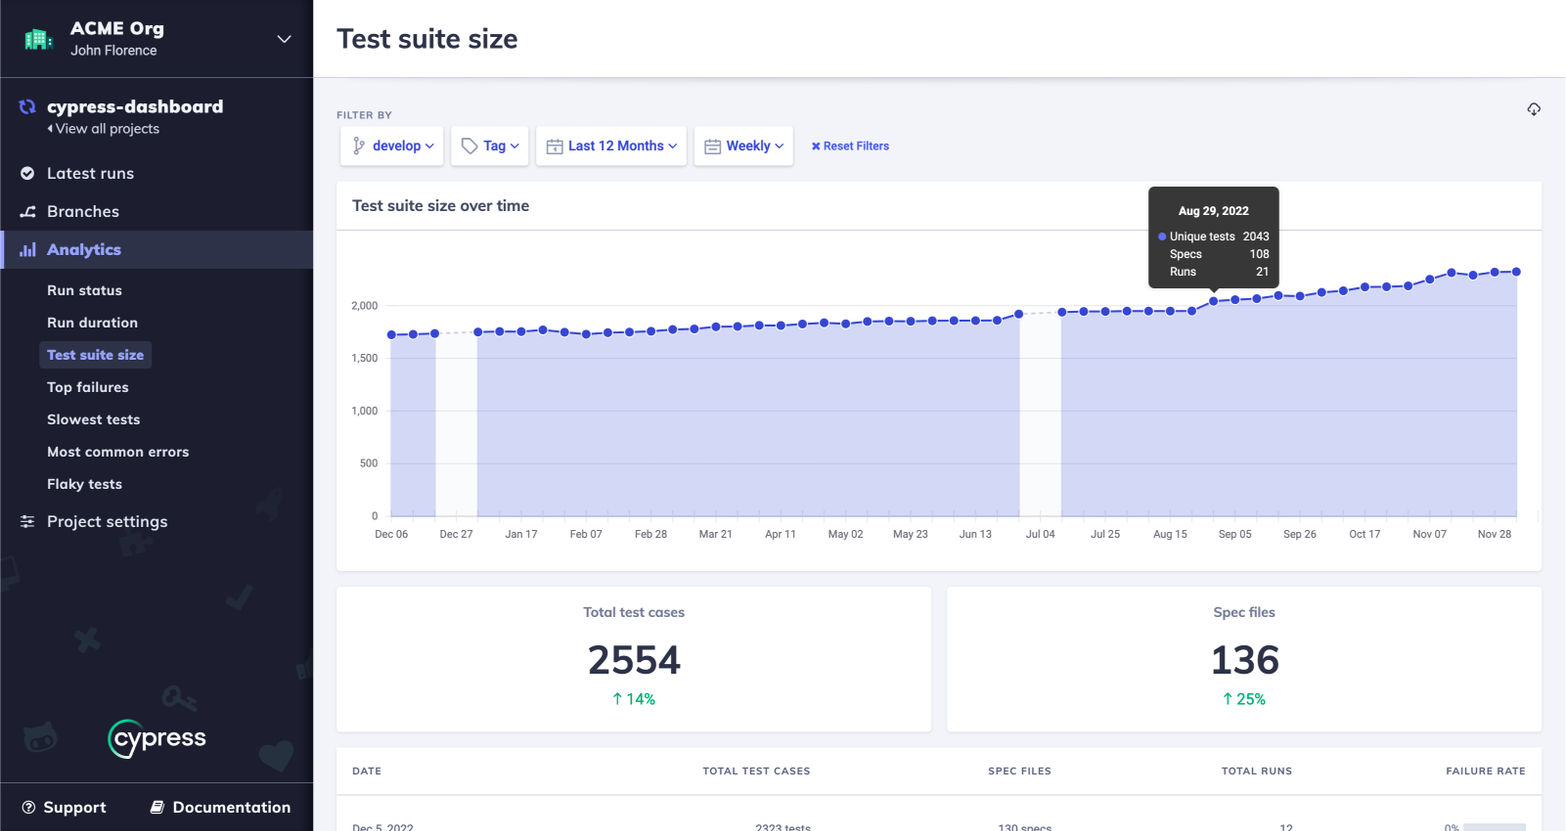
Focus your time and resources on addressing the most chronically flaky tests in your test suite. Use Flaky Tests Analytics to prioritize flaky tests based on their recency, frequency, and severity.
Learn more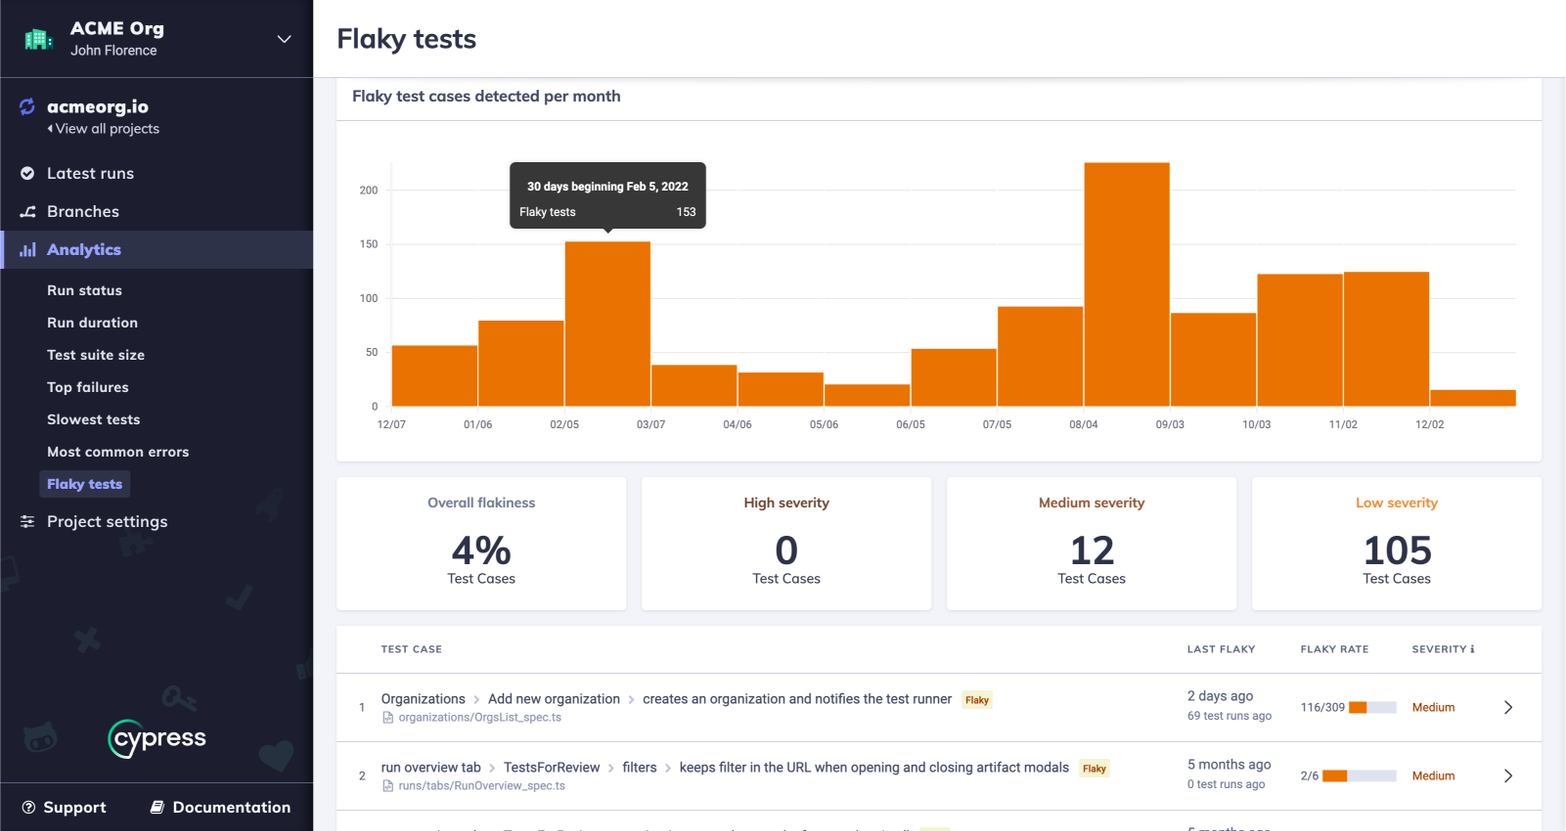
Quickly surface the most commonly occurring error classes in your test suite. You can even read the exact error messages and understand how many tests are impacted by each error.
Learn more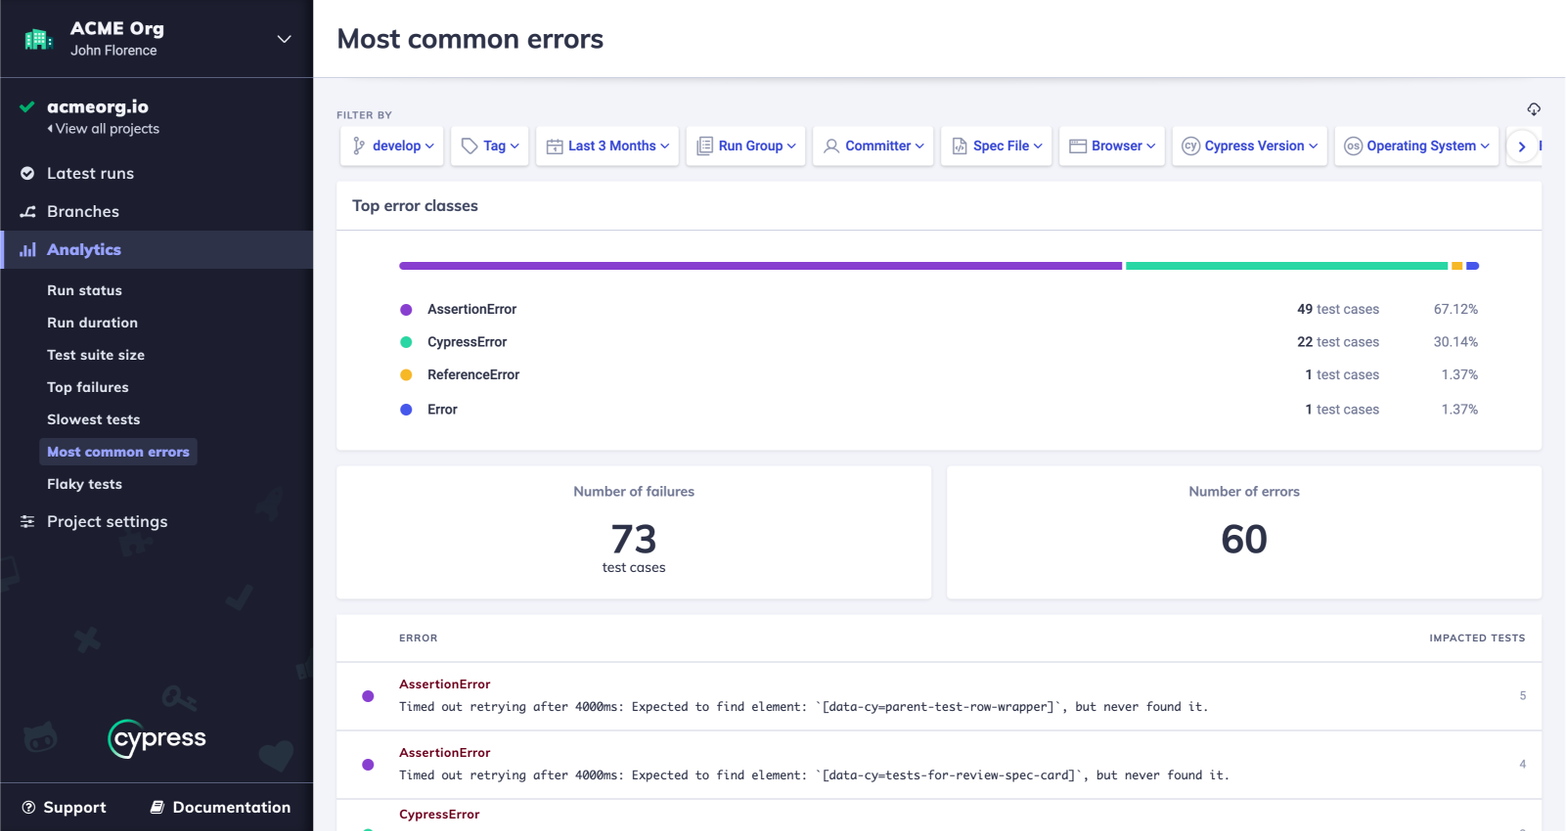
Integrated Workflows
Integrate seamlessly into your workflow
Run Cypress tests in CI and record test results to Cypress Cloud for immediate failure feedback. Cypress Cloud integrates with all CI providers, including CircleCI, GitHub Actions, Bitbucket, Jenkins, and more.
Learn more


Create issues for failed tests on-the-fly and review historical issues using Cypress Cloud’s integration with Atlassian Jira — all from within the Cypress UI.
Learn more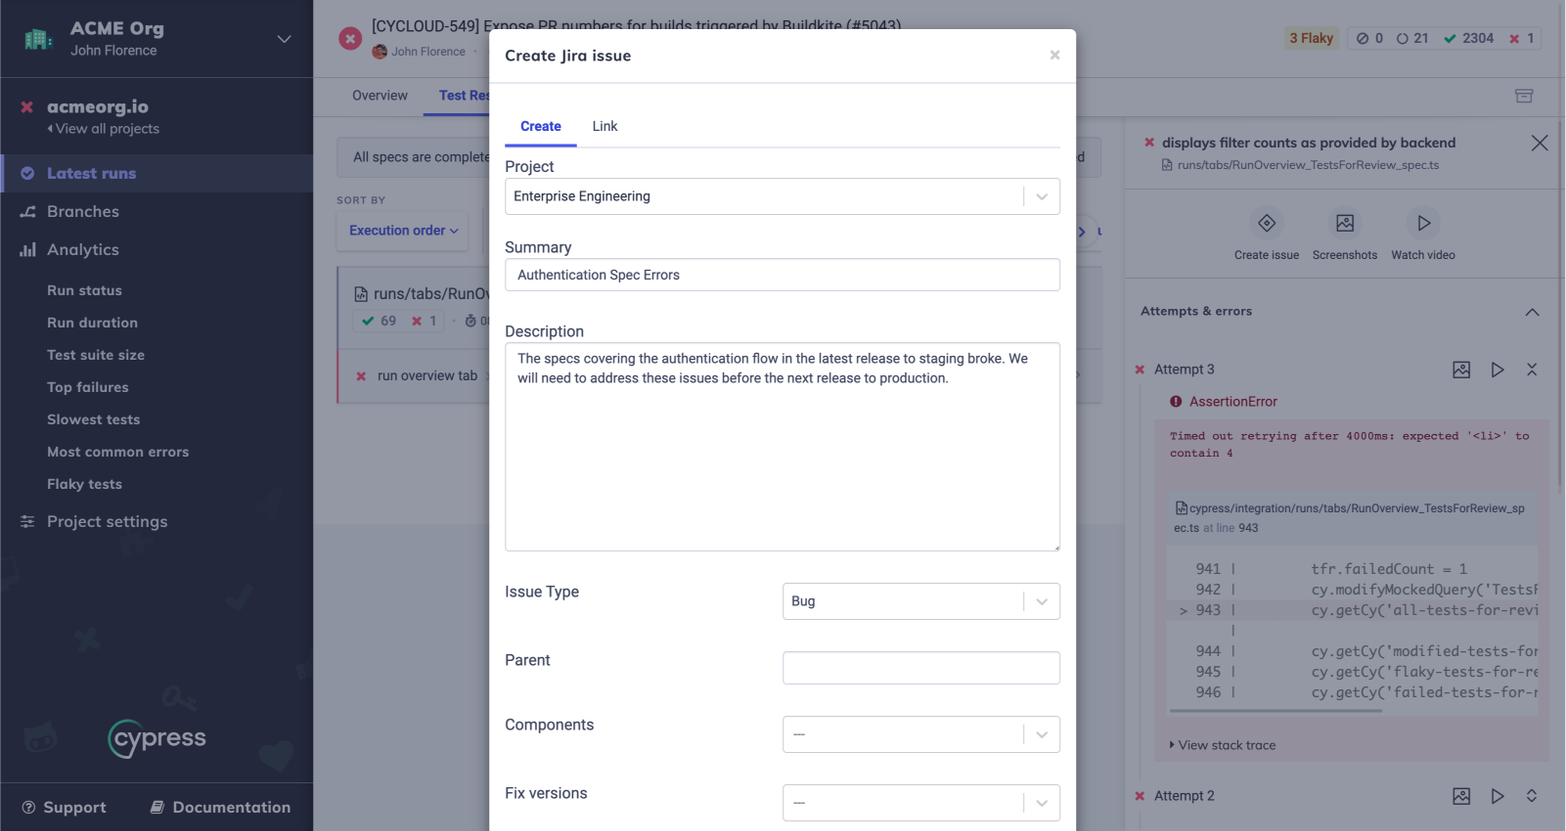
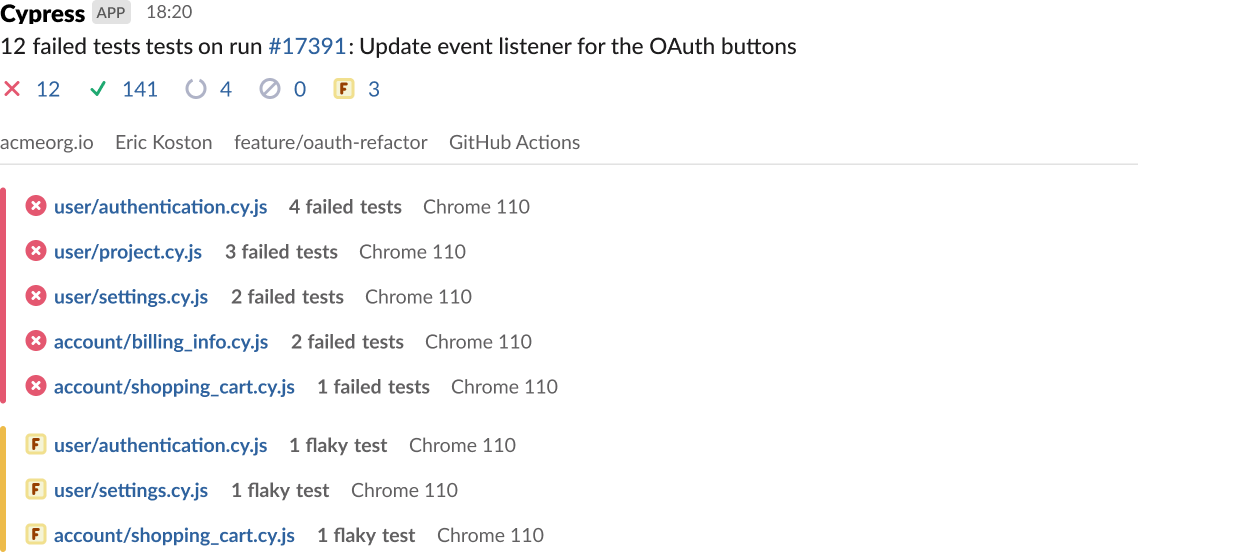
Improve your team’s collaboration, know exactly when a test fails, and give wider visibility into your test suite’s performance by integrating Cypress with Slack and Teams.
Learn more


Integrate Cypress with your GitHub, GitLab, or Bitbucket source control to see test run results as commit status checks and pull/merge request comments.
Learn moreImplement single sign-on so that you can fully control how your enterprise’s teams authenticate with Cypress.
Learn more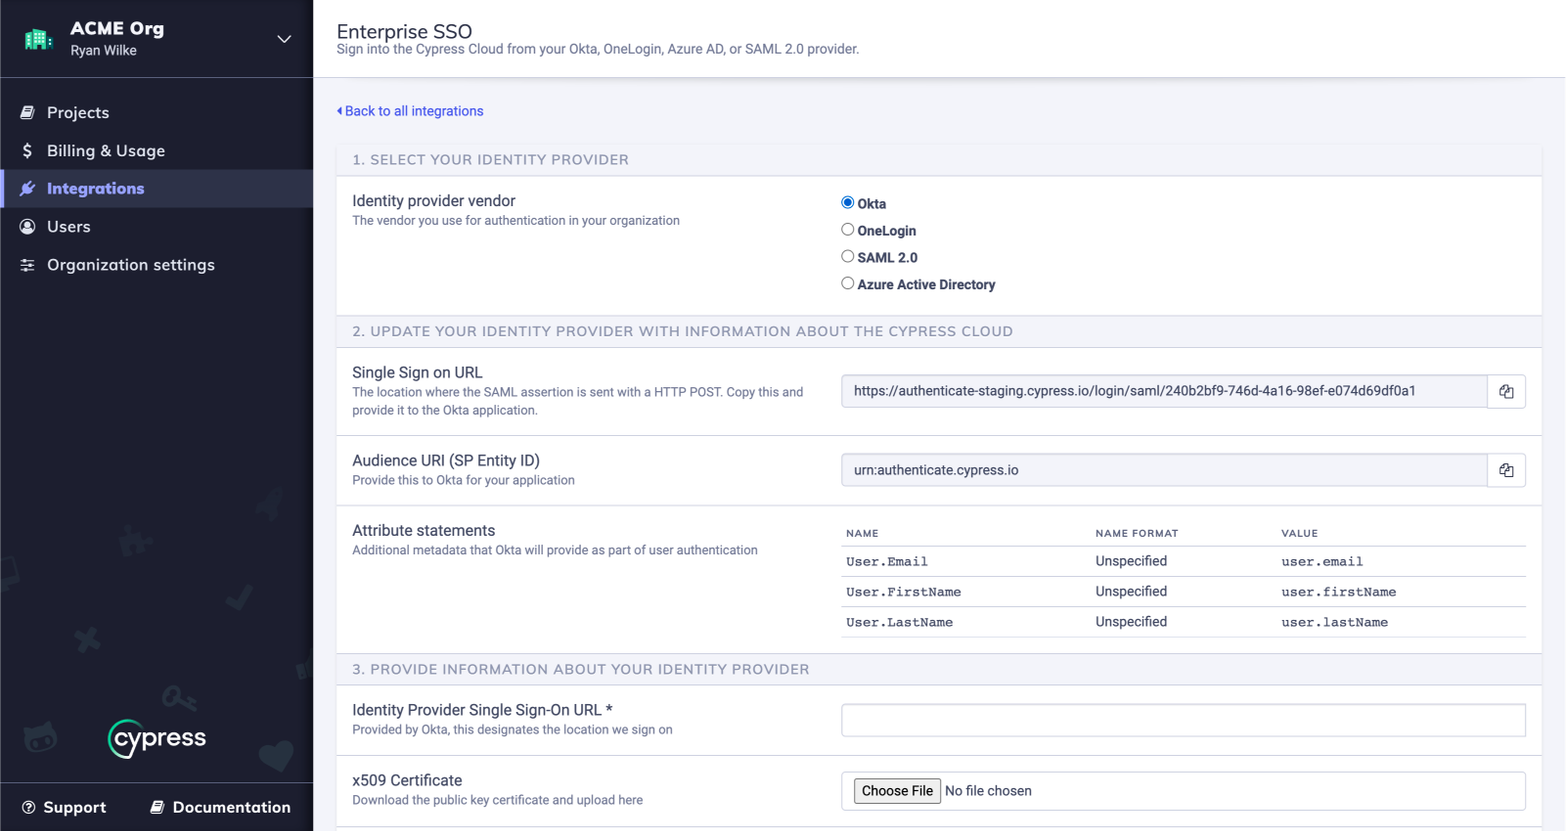
Trusted by Enterprise
Cypress is proud to support developers worldwide by making it easier to build and test modern applications.
“After experiencing the Cypress GUI and Cypress Cloud, we definitely did not want to go back to WebdriverIO or our custom Ruby Selenium solution.”
Alfred Lucero
Staff Software Engineer
“We realized pretty quickly that Cypress was the winner. It was very well-documented, it had parallel testing, a dashboard for viewing results, in-browser debugging, DOM snapshots, it was in Javascript, and it was super readable. And best of all, the setup is dead simple.”
Todd Williams
Senior QA Automation Engineer
“Cypress is an amazing testing tool for end-to-end testing. It integrated perfectly with our GitHub pull requests workflow.”
Jean Dessane
Lead Fullstack Javascript Developer
“We started off with a nightly run of our Cypress tests. In a few months, we scaled up our test automation considerably, first to 20 tests a day, then 300 tests a day, and now 4200+ tests daily.”
Kim Hellbom
Engineering Manager
“Being able to delve into the Cypress Dashboard’s metrics and show management what the tests deliver has helped us maintain their buy-in. And now we can use the test suite to benefit other improvements in the future.”
George Palfreyman
Senior Quality Engineer
“With Cypress, we have more diligence, more contribution from devs, more help to review tests, and more solid tests.”
Todd Kemp
Quality Lead
Start running your Cypress tests in CI today
Create your free Cypress Cloud account to transform how you test with Cypress in CI