When a user runs tests in Cypress, all of their application's HTTP requests go through the Cypress HTTP proxy. Why? Well, when a website is loaded through the proxy, Cypress injects code that helps with the testing process. Among other things, Cypress's proxy:
- injects a global
window.Cypressobject that can be used by the application under test to determine if it is running inside of Cypress. - removes framebusting JavaScript so that Cypress can properly run the applicatin under test within an iframe.
- replaces absolute references to
window.topandwindow.parentto the correct frame reference (sincewindow.toppoints to Cypress'swindowinstead of the application'swindow).
Also, in the near future, the proxy will allow Cypress to support full network stubbing. This will allow users to mock and assert on any HTTP request from any origin; from the fetch API to a page load. Heck, it could even be used to test that an Adobe Flash applet is making the right requests under the hood.
It's easy to see that Cypress's proxy is a necessary and valuable part of Cypress as a whole - without it, Cypress simply couldn't offer the testing experience that it does now.
The problem: it was slow
In Cypress 3.1.4, @danielschwartz85 reported that they were seeing network slowness while making normal fetch requests. It was so bad that they reported load times of 5.5 seconds in Cypress, compared to 300ms in a regular browser - HTTP requests in Cypress were running up to 18 times slower than in Chrome for this test case.
A large part of Cypress is that it should behave just like a normal web browser, so this was a major issue. Users expect Cypress to "behave like Chrome", not "behave like Chrome but 18x slower". So, we set out to investigate the source of this slowness.
Investigating the problem
The source of the slowness was not obvious, so we needed to gather some more information. First, we wanted to understand what speed we should aim for to match Chrome's normal behavior.
We extended the bug report's original test case to create a web page that loads 1,000 copies of the movie poster for Smurfs: The Lost Village. The time taken to load this page and all 1,000 images would become our benchmark for all future network performance tests.
Instrumenting network performance
Our next step was to automate testing Google Chrome's performance.
We decided that we wanted to test all the possible combinations of the following network conditions that may influence page load speed:
- Running in regular Chrome vs. Chrome behind the Cypress proxy.
- Running behind a secondary HTTP proxy vs. running without an HTTP proxy.
- Running with HTTP/2 support enabled vs. running with HTTP/2 disabled.
- Forcing Cypress to intercept and rewrite all requests vs. just passing them through Cypress.
We automated these tests by creating a script that does the following:
- Launches a headless Chrome instance using Node's
child_process.spawn(). - Attaches
chrome-har-capturerto that Chrome instance.chrome-har-capturerallows us to capture an HTTP Archive (HAR) that contains all the details of HTTP requests made in Chrome including headers, timings, and full request and response bodies for later analysis. This was extremely valuable - a HAR contains data that is normally only viewable manually in Chrome's Dev Tools Network interface. - Loads the thousand-Smurfs test case in a new tab.
- Once no network traffic has occurred for more than 1 second, aggregates the HAR timing data, creating statistics like "total page load time" and "average time-to-first-byte (TTFB)".
- Repeats steps 1-4 with all of the network conditions described above.
You can see the resulting test script here: packages/server/lib/proxy_performance.js. We then ran these tests on every single run in CI, so we constantly got feedback on the performance impact of changes to the networking code.
Interpreting the results
In our hubris, the first hypothesis as to why our proxy was so slow was simply:
Oh, Chrome just runs slower behind a proxy
¯\_(ツ)_/¯
This was quickly disproven, as testing showed that our proxy was 3x-5x as slow as just a normal HTTP proxy:
| Test Case | 1,000-Smurfs Load Time (ms) |
|---|---|
| Chrome (HTTP/1.1 only) | 4620 |
| Chrome behind a proxy | 3729 |
| Chrome behind Cypress (v3.1.5) | 9630 |
| Chrome behind Cypress (v3.1.5) with interception | 16827 |
The next thing we noticed is that the average time between Chrome sending a request and receiving a byte back from the server (TTFB, from timings.wait in the HAR) was significantly higher when running in Cypress than it was for Chrome:
| Test Case | Average TTFB for 1,000-Smurfs (ms) |
|---|---|
| Chrome (HTTP/1.1 only) | 20 |
| Chrome behind a proxy | 20 |
| Chrome behind Cypress (v3.1.5) | 55 |
| Chrome behind Cypress (v3.1.5) with interception | 56 |
We couldn't come up with an acceptable explanation for this gap. In fact, we decided that this gap was the most likely culprit for the network slowness, based on the following logic:
- 55ms is 35ms slower than 20ms.
- 35ms slowdown × 1,000 images = 35,000ms of slowdown.
- Chrome will make up to 6 concurrent connections to a single HTTP origin. Thus, this TTFB lag causes 35,000ms ÷ 6 ≈ 5,833ms of total slowdown in a single 1,000-Smurfs test run.
If you are curious about the results of the performance testing, check out this GitHub comment for a full run-down.
Fixing slow time-to-first-byte in node
At this point, we had the following pieces of information:
- TTFB was significantly slower when using our proxy
- It was only happening on HTTPS requests
To understand the solution to the problem, you'll first need to understand how Cypress's proxy intercepts HTTPS traffic. HTTPS traffic is normally totally encrypted between the client and server. Once the initial handshake completes, no man-in-the-middle can modify or read the data being transmitted without breaking this encryption and corrupting the stream.
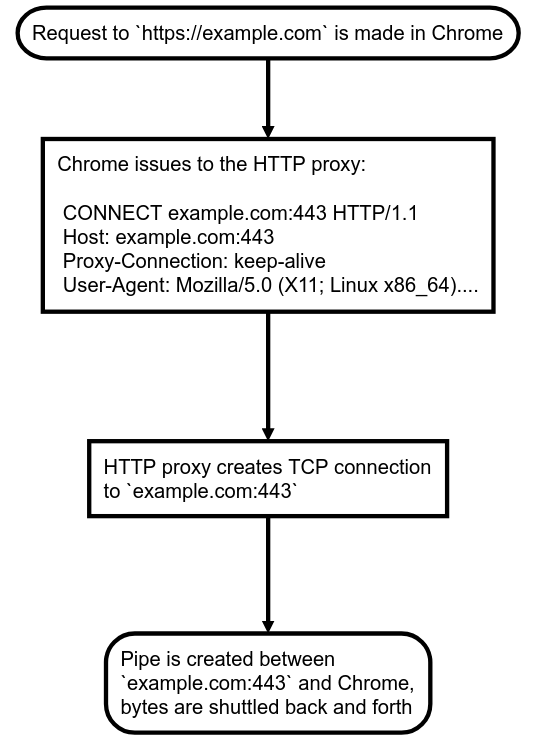
The traditional implementation of HTTPS over an HTTP proxy preserves this encryption like so:
- User visits
https://example.comin Chrome behind the HTTP proxyhttp://127.0.0.1. - Chrome will send a
CONNECT example.com:443request tohttp://127.0.0.1. - The HTTP proxy will create a TCP/IP socket to
example.comon port443and return200 Connection OKback to Chrome. - From this point on, the proxy at
http://127.0.0.1transparently shuttles bytes between Chrome andhttps://example.com, enabling Chrome andhttps://example.comto perform the HTTPS handshake and continue their encrypted conversation.
Here's a flowchart of this conversation to help visualize:
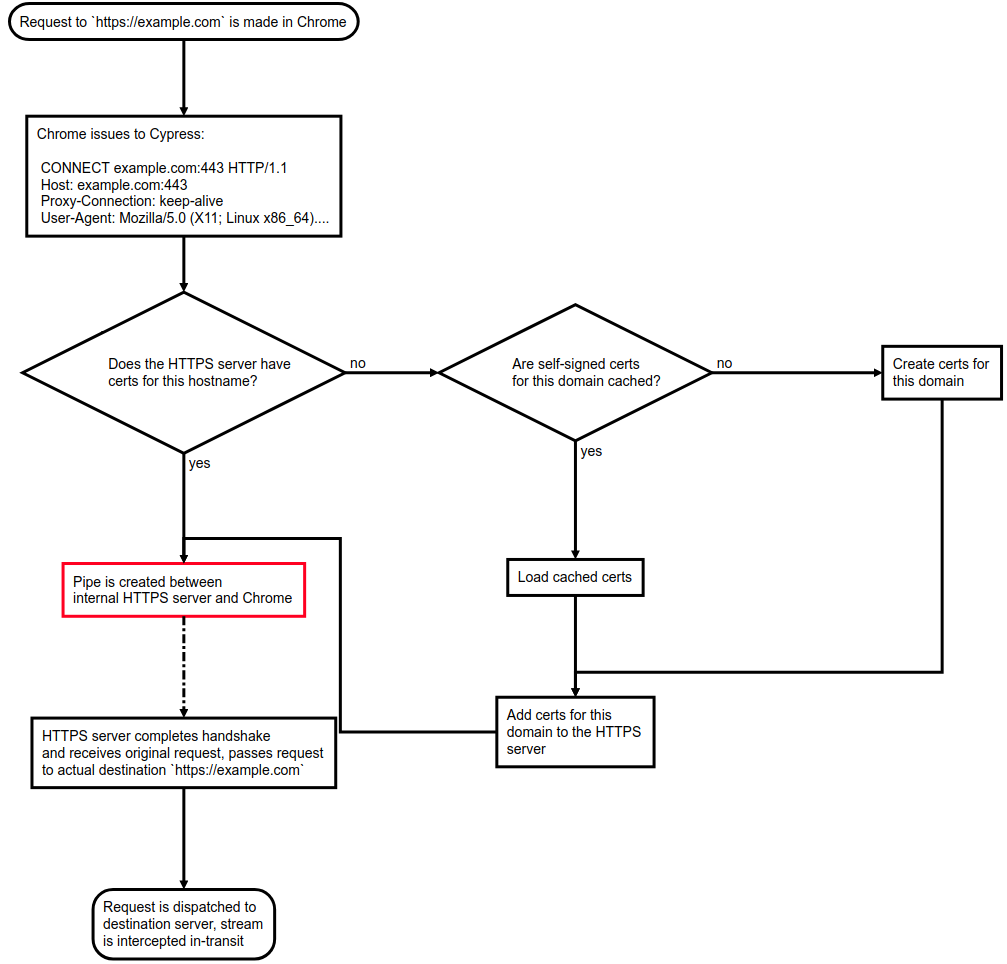
But, as discussed earlier, Cypress is not a normal HTTP proxy. Cypress needs to unpack and intercept HTTPS requests so that it can do the necessary injections. Cypress has no idea what the destination server's private keys are, so how can it do this without corrupting the encrypted data?
Simple: Cypress stands up an internal HTTPS web server using Node's https.createServer and self-signs SSL certificates for every HTTPS destination a user wishes to reach. Then, instead of proxying directly to the destination HTTPS host as described in step (3) above, Cypress proxies the user to the internal HTTPS web server, and that HTTPS server receives the user's request as a normal Node.js ClientRequest object. From there, Cypress can make an outgoing request to the user's actual destination using the request HTTP library and intercept the request or response as necessary.
Want to see how Cypress self-signs SSL certificates for on-demand HTTPS interception? Check out Cypress's
https-proxypackage where all HTTPS traffic is handled.
Here's a flowchart to help visualize Cypress's HTTPS interception:
So, somewhere in here, TTFB is getting inflated unnecessarily. We quickly eliminated the certificate signing as the source of the lag - Cypress caches the certificates in memory and on disk, so there should not be a repeated slowdown there.
That means that the only source of slowness (besides network round trip time) is the pipe that shuttles bytes between Chrome's socket to the Cypress HTTP proxy and Cypress's socket to the internal HTTPS server (highlighted in red in the flowchart above).
After hours of head-scratching at how a seemingly simple operation could be causing so much lag, @brian-mann discovered socket.setNoDelay() while trawling the Node docs for answers. Here's the description of what this does:
Disables the Nagle algorithm. By default TCP connections use the Nagle algorithm, they buffer data before sending it off. Setting
truefornoDelaywill immediately fire off data each timesocket.write()is called.
Nagle's algorithm is a TCP congestion control mechanism that works by decreasing the number of small packets sent over a network by buffering multiple sequential packets and sending them out only when the recipient has acknowledged the previous packet.
As soon as we added the socket.setNoDelay(true) call on the socket between Cypress and the browser, we immediately saw huge performance improvements:
| Test Case | Avg TTFB for 1,000-Smurfs (ms) | 1,000-Smurfs Load Time (ms) |
|---|---|---|
| Chrome (HTTP/1.1 only) | 20 | 4620 |
| Chrome behind a proxy | 20 | 3632 |
| Chrome behind Cypress (after disabling Nagle) | 20 | 4169 |
| Chrome behind Cypress (after disabling Nagle) with interception | 24 | 4458 |
Nagle's algorithm was the major source of this TTFB lag. It was causing unnecessary buffering that meant that we had to wait for 2 extra round trip times before the first byte reached the client. By just disabling it, our performance became almost the same as a real browser. This is a massive win for users of Cypress, especially considering that a single spec file may reload the same page tens if not hundreds of times.
Other network improvements in 3.3.0
In addition to the speed boost, Cypress 3.3.0 also contains other improvements to the networking stack.
Corporate proxy support
In Cypress 3.3.0, support for corporate proxies was added. This allows users working at companies that require a proxy to access the outside world to use Cypress for the first time. Read the proxy configuration documentation for more information on how to take advantage of this functionality.
Check out the GitHub issue for proxy support for details on what changes have been made to proxy support in 3.3.0.
Better network error handling
Web traffic is more resilient than ever before with Cypress 3.3.0. The Cypress network layer has been updated to automatically retry HTTP requests in certain conditions where a retry is likely to succeed. This ensures that Cypress tests are less likely to spuriously fail due to network reliability issues.
If the initial TCP/IP connection fails, it will be retried up to 4 times, or until it finally succeeds.
The new retrying behavior is based off of Chrome's own network retry behavior. It was added after noticing that Chrome would retry several times to send requests that failed with ERR_CONNECTION_RESET, ERR_CONNECTION_REFUSED, or ERR_EMPTY_RESPONSE errors, as well as in certain other conditions. For details on exactly which retries will be made in what scenarios, check out the pull request for automatic network retries on GitHub.
This behavior can be disabled in cy.visit() and cy.request() using the new retryOnNetworkFailure option. In addition, the ability to enable retries on non-200 status codes using the new retryOnStatusCodeFailure option has been added.
Also, previously to Cypress 3.3.0, Cypress would return an HTTP 500 Internal Server Error page if it hit an irrecoverable network error while making requests. Now, in Cypress 3.3.0, Cypress will immediately end the response to the browser if this happens. This will cause Chrome to display an error message that more closely matches real-world behavior. For more information, look at the GitHub issue for changing the behavior of network failures.
Future network improvements
Although Cypress 3.3.0 makes massive enhancements to the Cypress network stack, there is still room for future improvement.
Full network layer stubbing
Full network stubbing is something that's been on the roadmap for a while now. With full network layer stubbing, users can test any kind of network traffic inside of Cypress. This will enable all sorts of functionality that would be useful for testing, including:
- Throttling network speed to test a website under bad network conditions
- Dynamically responding to WebSocket frames
- Sending back dynamic content in response to requests
- Intercepting and modifying response and request streams in flight
With the improvements made to Cypress's network layer in the 3.3.0 release, the doors are opened to add this functionality in the near future.
HTTP/2 Support
HTTP/2 is much, much faster than HTTP/1.1 in most scenarios:
| Test Case | 1,000-Smurfs Load Time (ms) |
|---|---|
| Chrome (HTTP/1.1 only) | 4620 |
| Chrome (with HTTP/2) | 414 |
Yeah, that's right - with HTTP/2, Chrome can load 1,000-Smurfs in 414ms. That's less than half a millisecond per Smurf!
Currently, Cypress does not support HTTP/2 in any way, it will always use HTTP/1.1. There are a number of improvements that could be implemented:
- Make the Cypress HTTP proxy itself use HTTP/2 support, so traffic between Chrome and Cypress can take advantage of HTTP/2 speed improvements. This would be a marginal improvement, as Chrome and Cypress communicate over
localhostwhich has negligible round trip time. - Make Cypress use HTTP/2 for outgoing requests where possible. This is where the most potential gains would be available, but it would require re-working of Cypress's entire network layer to support HTTP/2. Additionally, we use the
requestHTTP library to make outgoing requests, which has no HTTP/2 support.
Check out this issue to see the status of HTTP/2 support in Cypress.
Tracking network performance over time
The automated network performance testing described above is great, but it's difficult to act on that information - based on the time of day, which region our CI provider is operating in, and other factors, the benchmarked load times change from test-to-test. This makes it difficult to rigorously assert on the load times to really make it part of our CI process.
We would like to log the output of these performance tests to some central place, where we can look at Cypress's performance at different points in time and under different conditions. Additionally, we want to find a way to assert on this data, so we can fail a CI job if the changes from a commit cause the proxy to slow way down.


