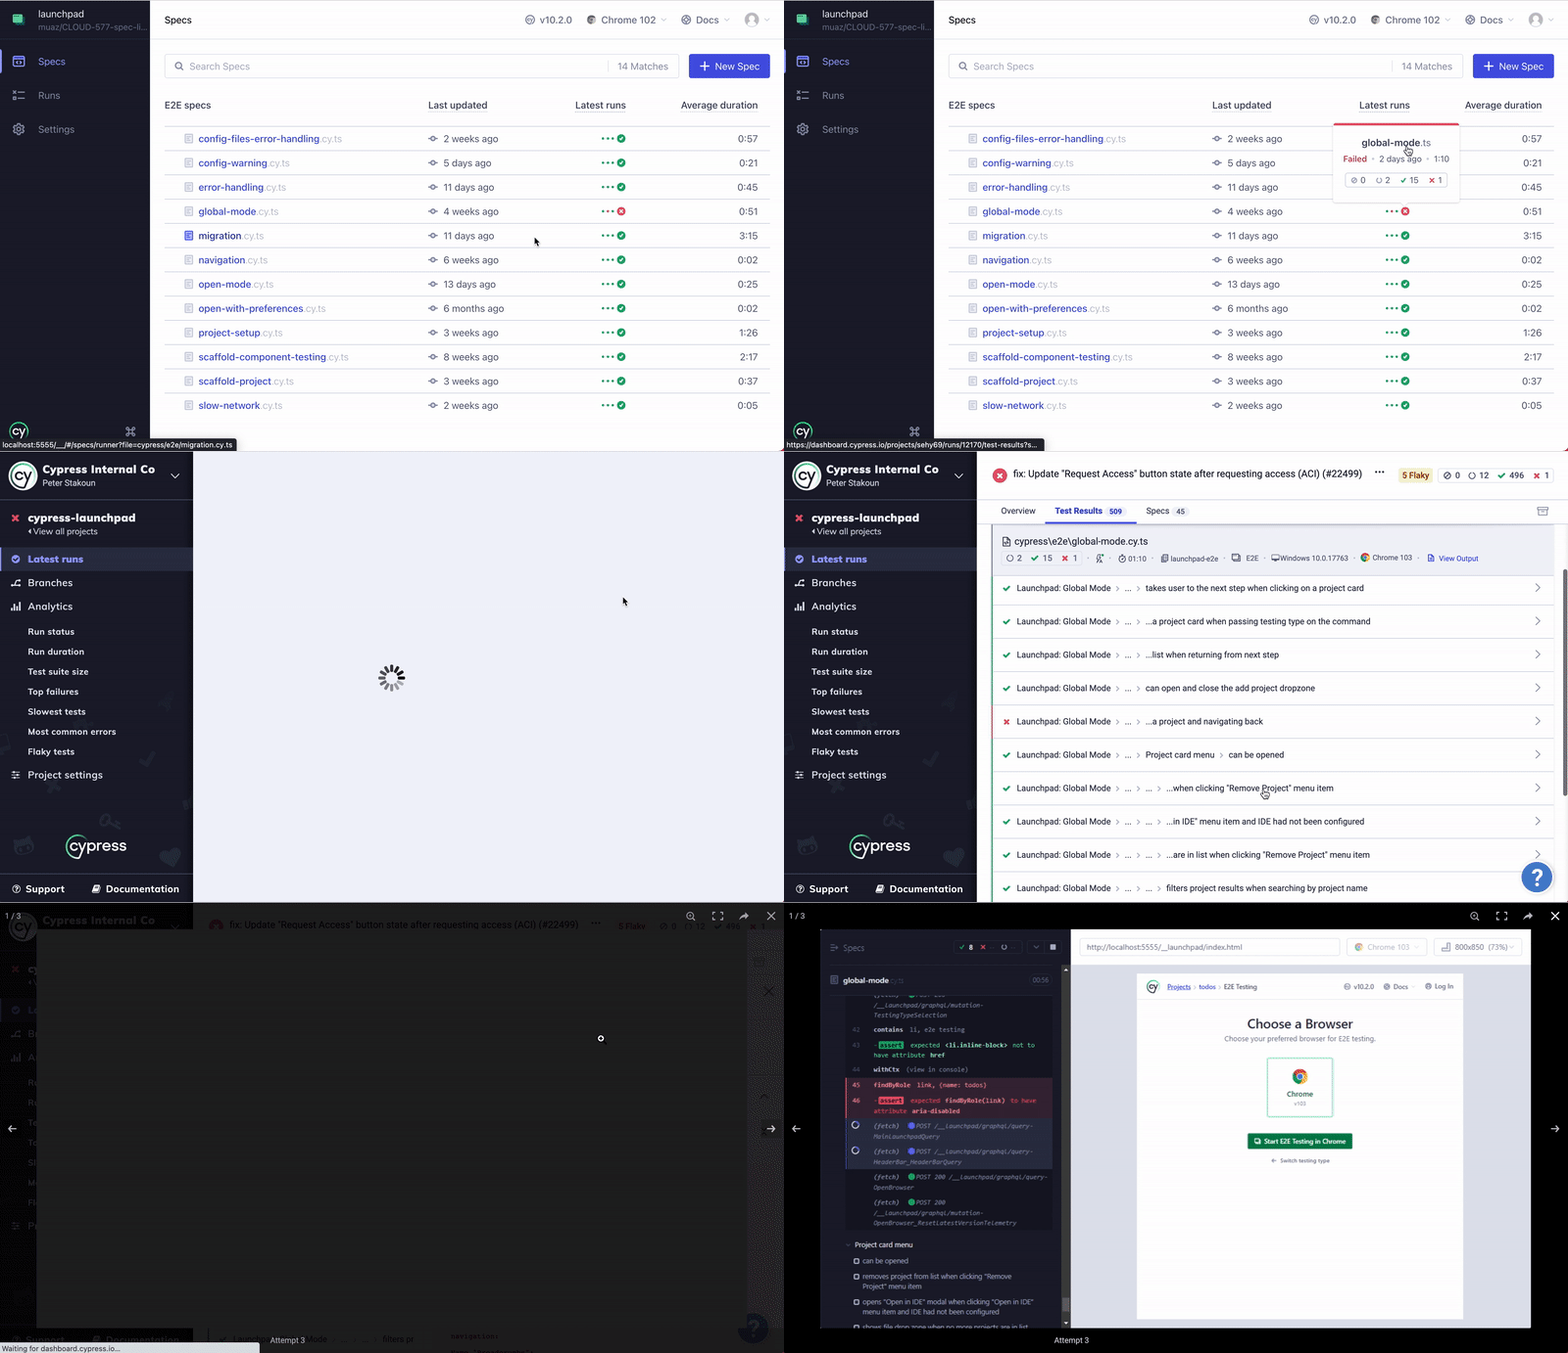
We believe testing is the most important aspect of building reliable software and that development teams deserve a data-rich, all-encompassing platform. Towards that goal, we are excited to announce that we have added actionable test data from your runs in the Cypress Dashboard directly into the Cypress app.
As the Cypress app runs tests, it records its comprehensive result data to the Cypress Dashboard. The Dashboard derives insights to measure and optimize the entirety of your development and testing process. We have made various dimensions of your test result data available directly in the Cypress Spec Explorer, so this information is always right at your fingertips:
- Last updated showing the change history of your tests so you can quickly find the most relevant specs as you’re browsing your test suite
- Latest runs so you can monitor, run, and fix tests locally within CI workflows, and then further dig in to test results by clicking through to the Cypress Dashboard
- Average duration of your specs so that you can quickly identify and take action to improve the performance of your long-running specs

“We are committed to bringing real-time, actionable insights directly into your local development and testing workflow,” says Peter Stakoun, Cypress Product Manager. “With this release, we establish a data foundation on which we can build granular alerts and intelligent recommendations to uplevel how you build and test software today.”
For a complete list of updates in 10.3.0, please review our changelog. If this feature is helpful, or if you have other ideas for other features that would help you, let us know.
Not using the Cypress Dashboard yet?
The Cypress Dashboard adds a layer of timely, simple, and powerful insights to all your test runs in a single, easy-to-use interface. Test and debug faster with the Cypress Dashboard. Get started for free.
