As part of our ongoing mission to give our users unparalleled insight into their test suites, we’ve added an exciting new analytic to the Cypress Dashboard—Most Common Errors 🎉
The Most Common Errors analytic gives you a high level look at the most common failure modes across your test suite. Users can evaluate their most common errors holistically, and by looking at each error in detail to quickly find and manage them.
Most Common Errors Analytic
By navigating to the Most Common Errors Analytic in the Dashboard, you can take advantage of a high-level visualization that summarizes recurring errors and their impact on your project’s test suite, helping you understand what types of errors you’re encountering most often.
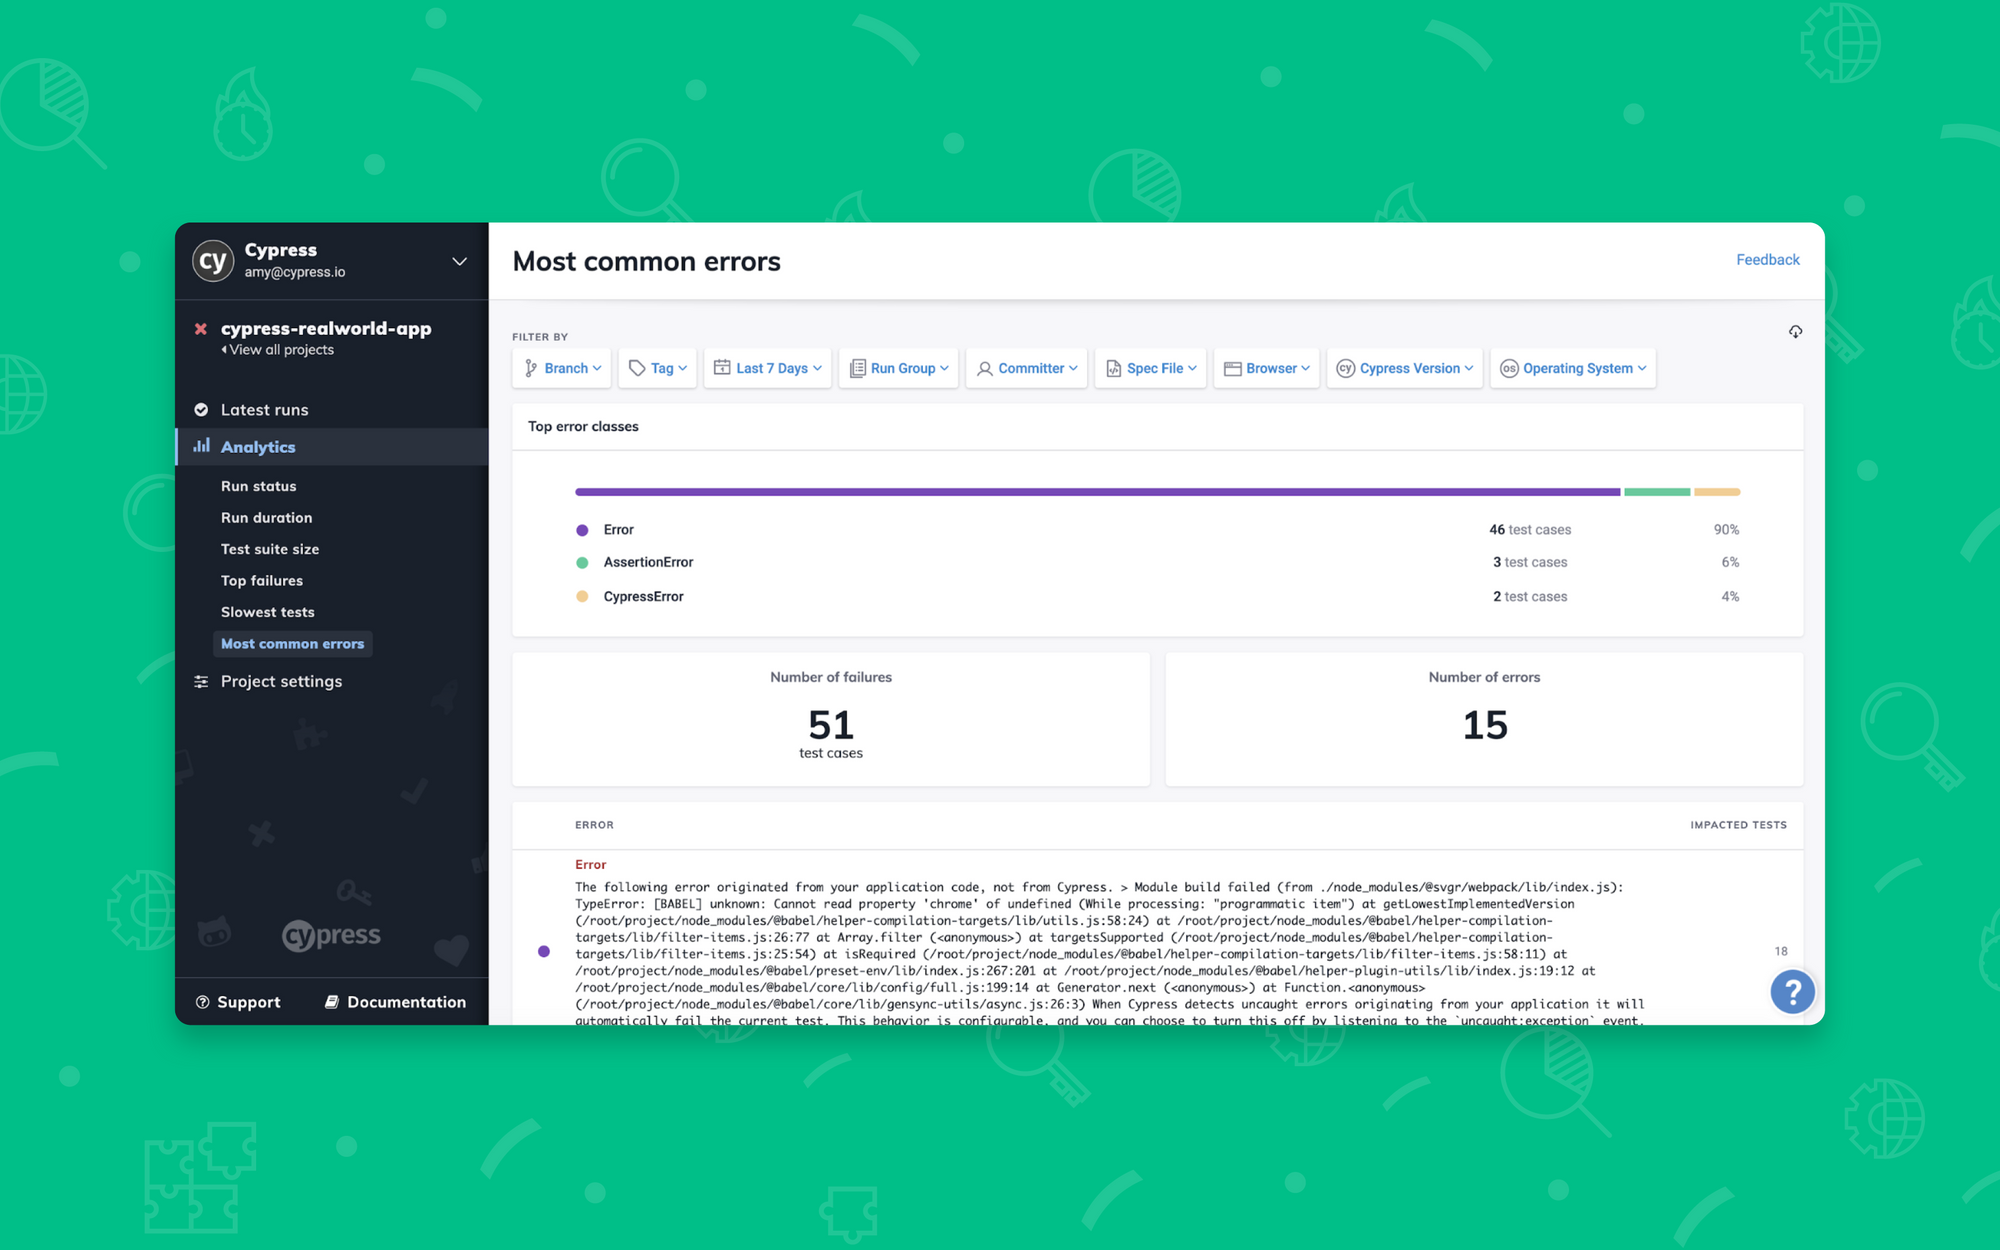
You can also filter by branch, tag, browser, run group, spec, and time range for context-aware analysis to give you and your team deeper context.
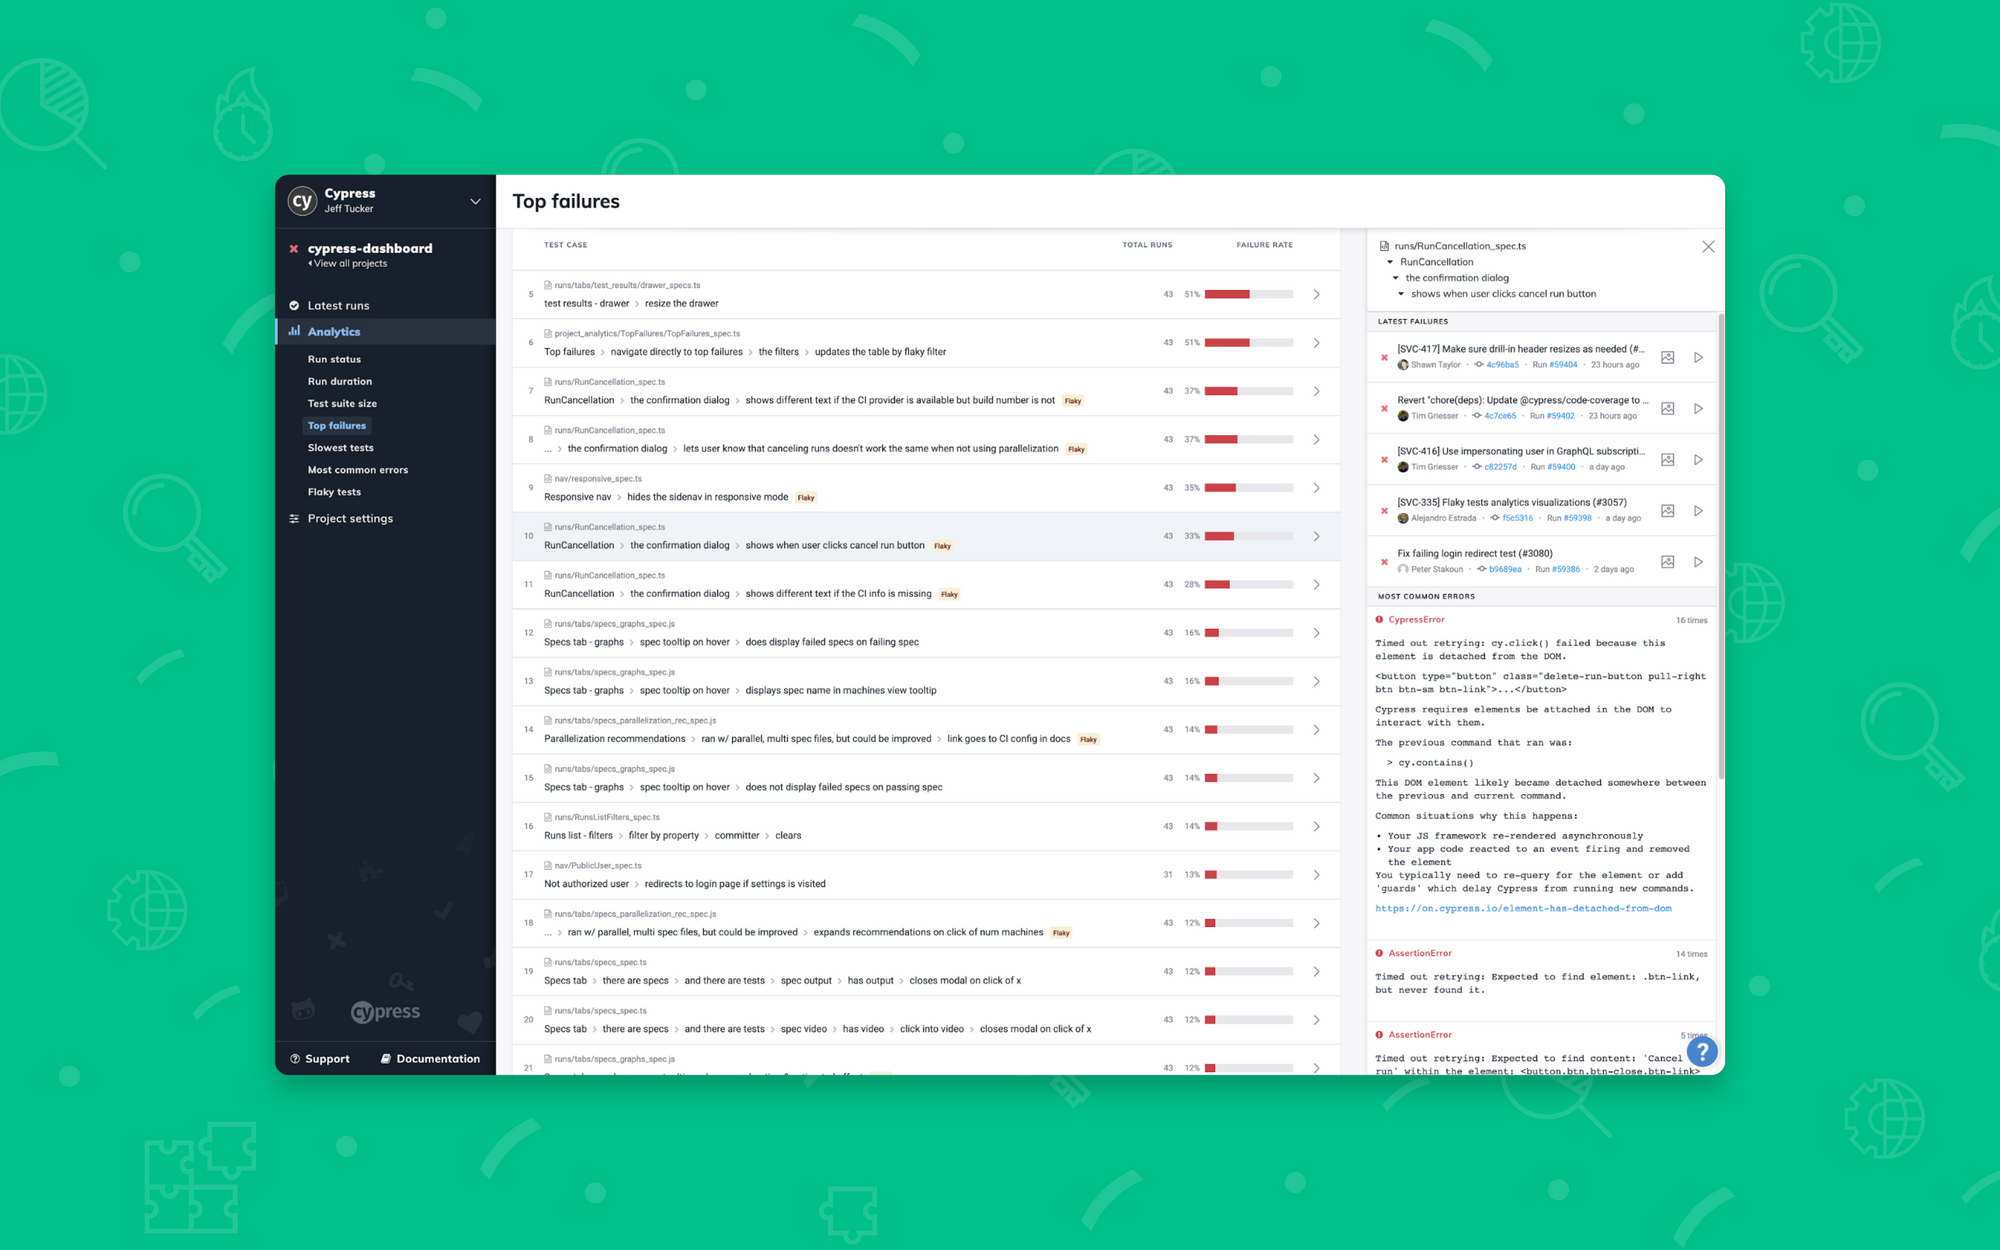
New drill-in for Top Failures
You don’t need to pour over run after run to understand a recurring test failure anymore—with our new drill-in functionality, you can now dig into the details of your top failures to see a summary of the most common errors for the test. Need more information still? Quickly jump to runs where the test recently failed to continue your research.
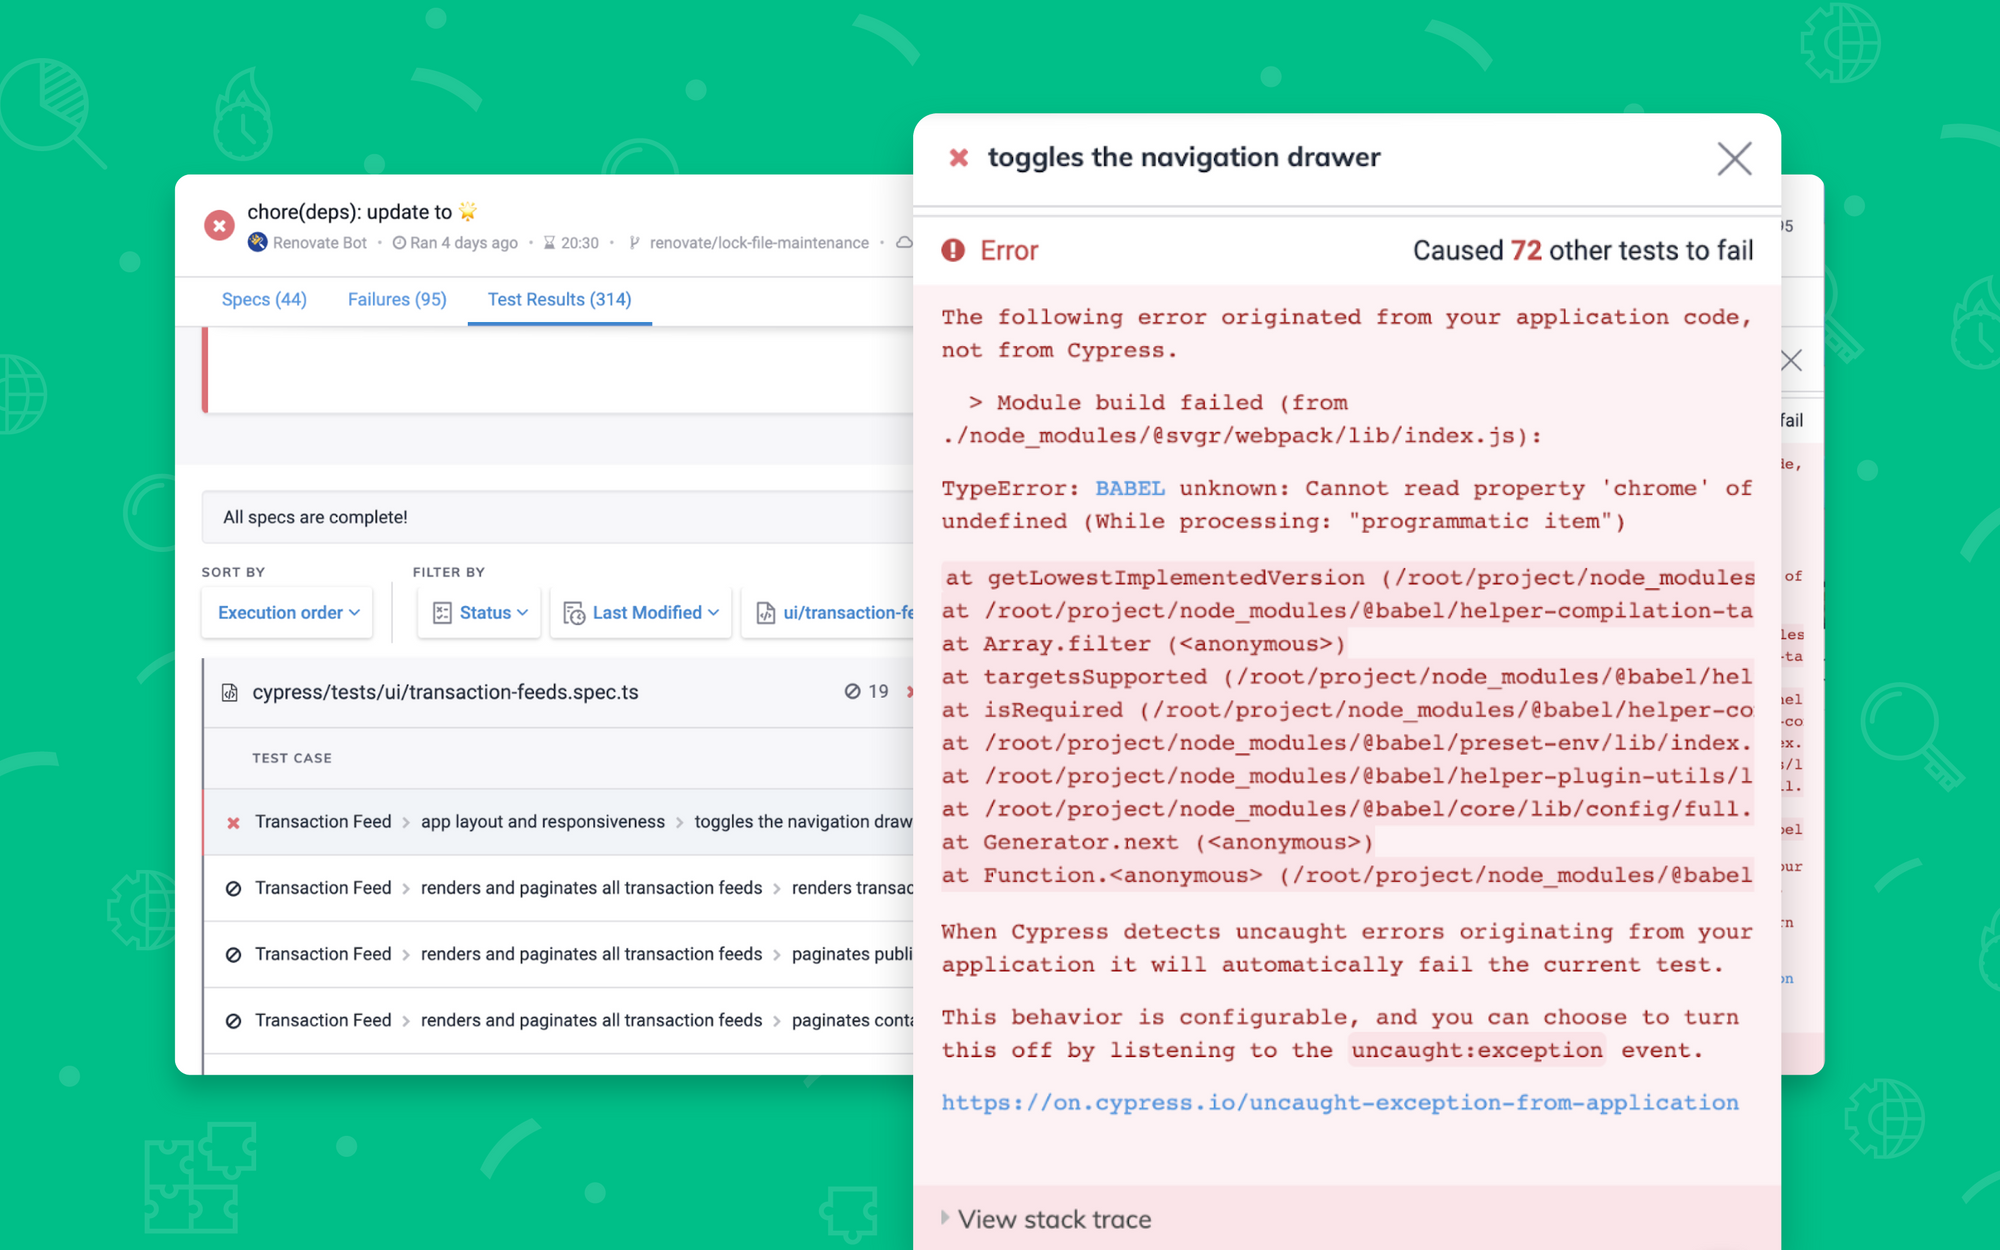
Single Error Analysis
You can also dive deeper by looking at each error in detail, and identify when a single error was responsible for multiple test failures within a run. No more spending time clicking through the same failure over and over.
Ready to get started?
Discover your Most Common Errors and improve your test suite by logging in or signing up for the Cypress Dashboard! Questions? Let us know at [email protected]
We hope you enjoy this new feature. As always, happy testing!