
No one likes slow tests. But before we can make a test faster, we need to understand where the test actually spends its time. In this blog post I will show how to report the total test duration and time per individual Cypress command.
Note: you can find the test source code shown in this blog post in the speed-spec.js file inside the recipe "Vue + Vuex + REST Testing" in our cypress-example-recipes repository.
The Test
Let's write a test that exercises a Todo application. We will visit the application's page, enter several todo items, then delete one of them. The test might look like this:
describe('speed', () => {
it('loads the app', () => {
// reset the backend data
cy.request({
method: 'POST',
url: '/reset',
body: {
todos: [],
},
})
// load the application
cy.visit('/')
cy.get('.todoapp').should('be.visible')
// add several todo items
cy.get('.new-todo')
.type('learn testing{enter}')
.type('be cool{enter}')
cy.get('.todo-list li')
.should('have.length', 2)
// delete one item and confirm it was deleted
cy.server()
cy.route('DELETE', '/todos/*').as('delete')
cy.contains('.todo-list li', 'be cool').find('.destroy').click({ force: true })
cy.wait('@delete')
cy.get('.todo-list li')
.should('have.length', 1)
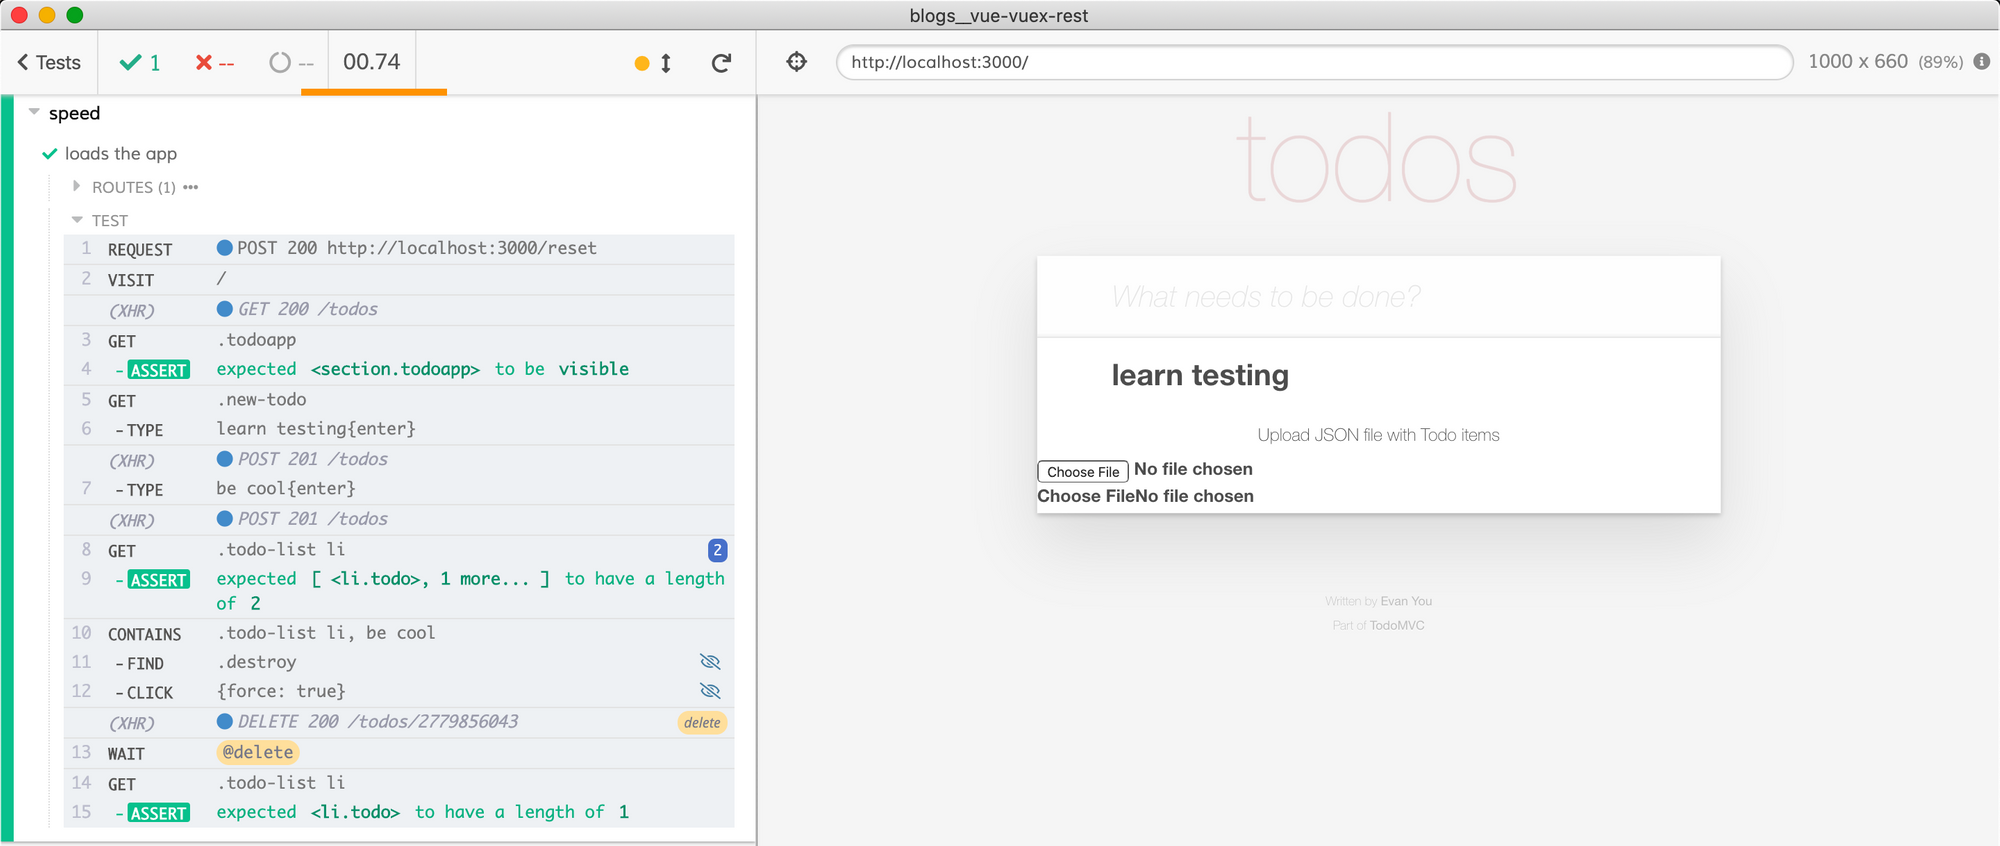
})
})This test finishes quickly - the Test Runner GUI reports about 0.74 seconds to run this test.
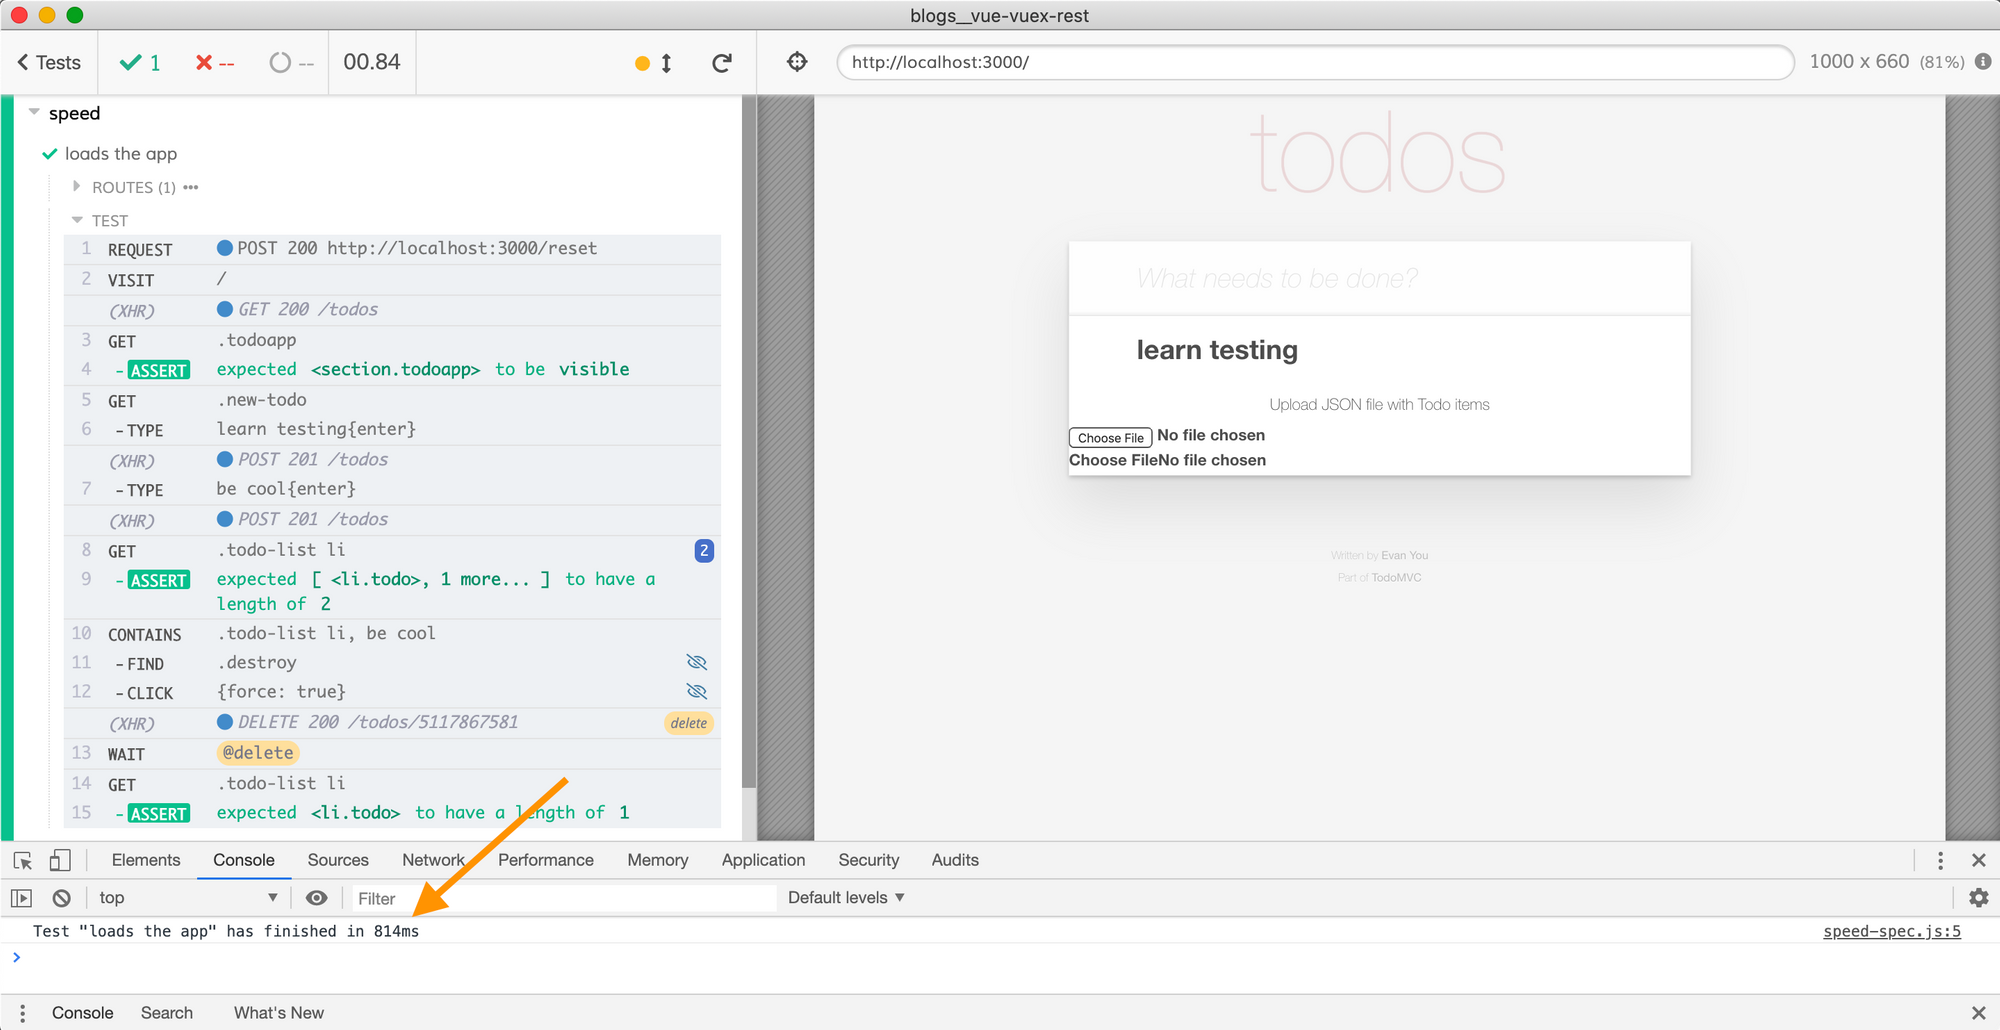
Can we see a more precise measurement? Yes - Cypress keeps track of the test duration and you can get the precise number by listening to `test:after:run` event.
Cypress.on('test:after:run', (attributes) => {
  /* eslint-disable no-console */
  console.log('Test "%s" has finished in %dms',
    attributes.title, attributes.duration)
})
// the test suite
We run the test again with DevTools open to see a precise test duration of 814ms. The GUI shows 0.84s because there is overhead to process the event you just added.
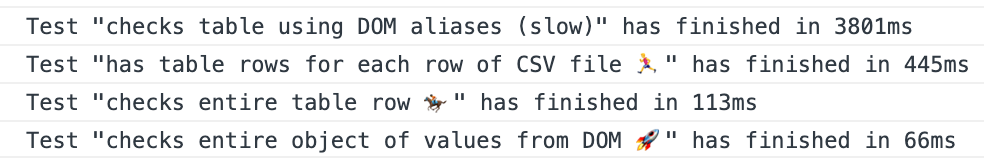
Tip: look at the recipe "CSV load and table test" where we use this test duration measurement to find the fastest way to check the table's contents.
The Commands
Where does the test spend its time? There are multiple commands inside the test - is there a slow one? Can we measure and report the duration of an individual Cypress command?
Yes - and again we can use the events emitted by the Test Runner. Here is the code:
let commands = []
Cypress.on('test:after:run', (attributes) => {
/* eslint-disable no-console */
console.log('Test "%s" has finished in %dms',
attributes.title, attributes.duration)
console.table(commands)
commands.length = 0
})
Cypress.on('command:start', (c) => {
commands.push({
name: c.attributes.name,
started: +new Date(),
})
})
Cypress.on('command:end', (c) => {
const lastCommand = commands[commands.length - 1]
if (lastCommand.name !== c.attributes.name) {
throw new Error('Last command is wrong')
}
lastCommand.endedAt = +new Date()
lastCommand.elapsed = lastCommand.endedAt - lastCommand.started
})
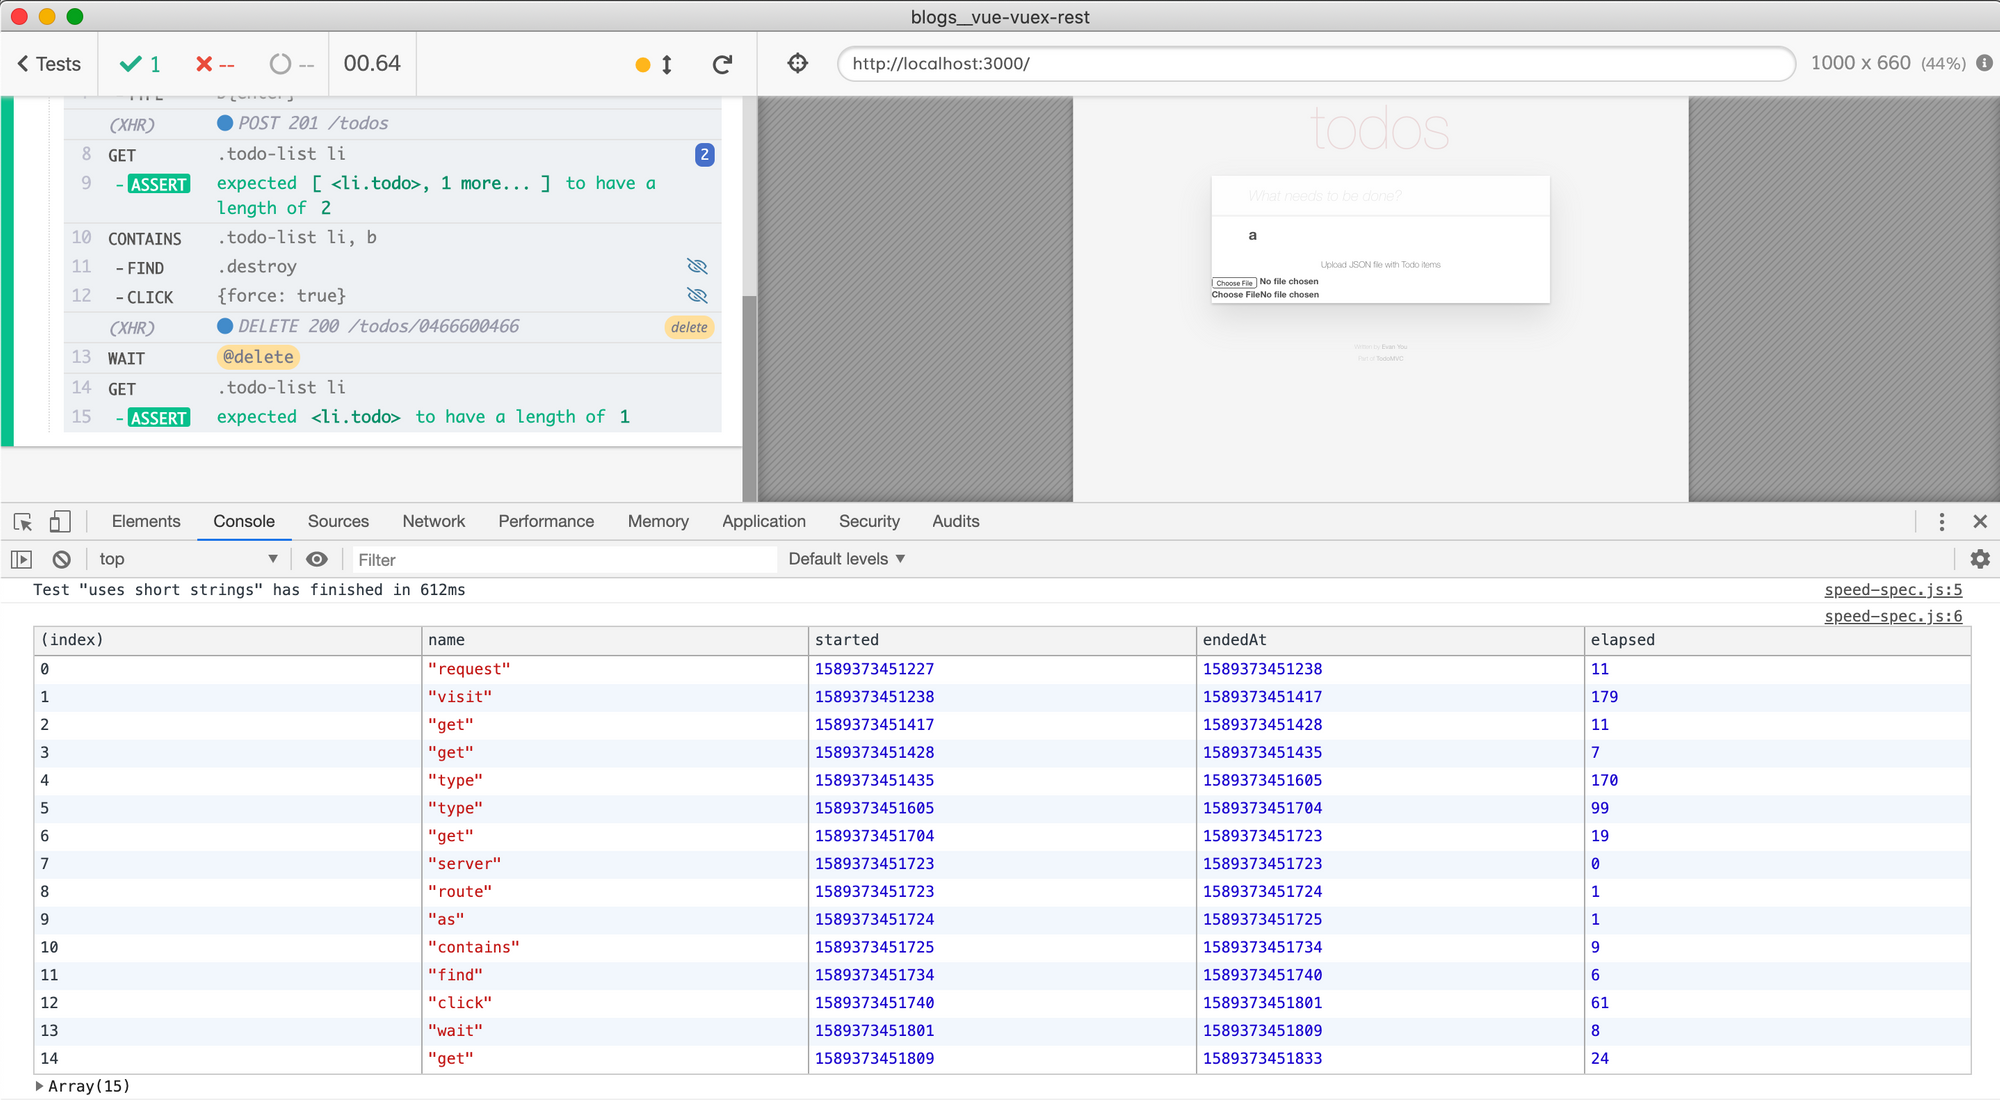
// the test suiteWhen a command starts, we save the timestamp. When a command ends, we save the end timestamp and compute the command's duration. When the test finishes, we use console.table to print the results.
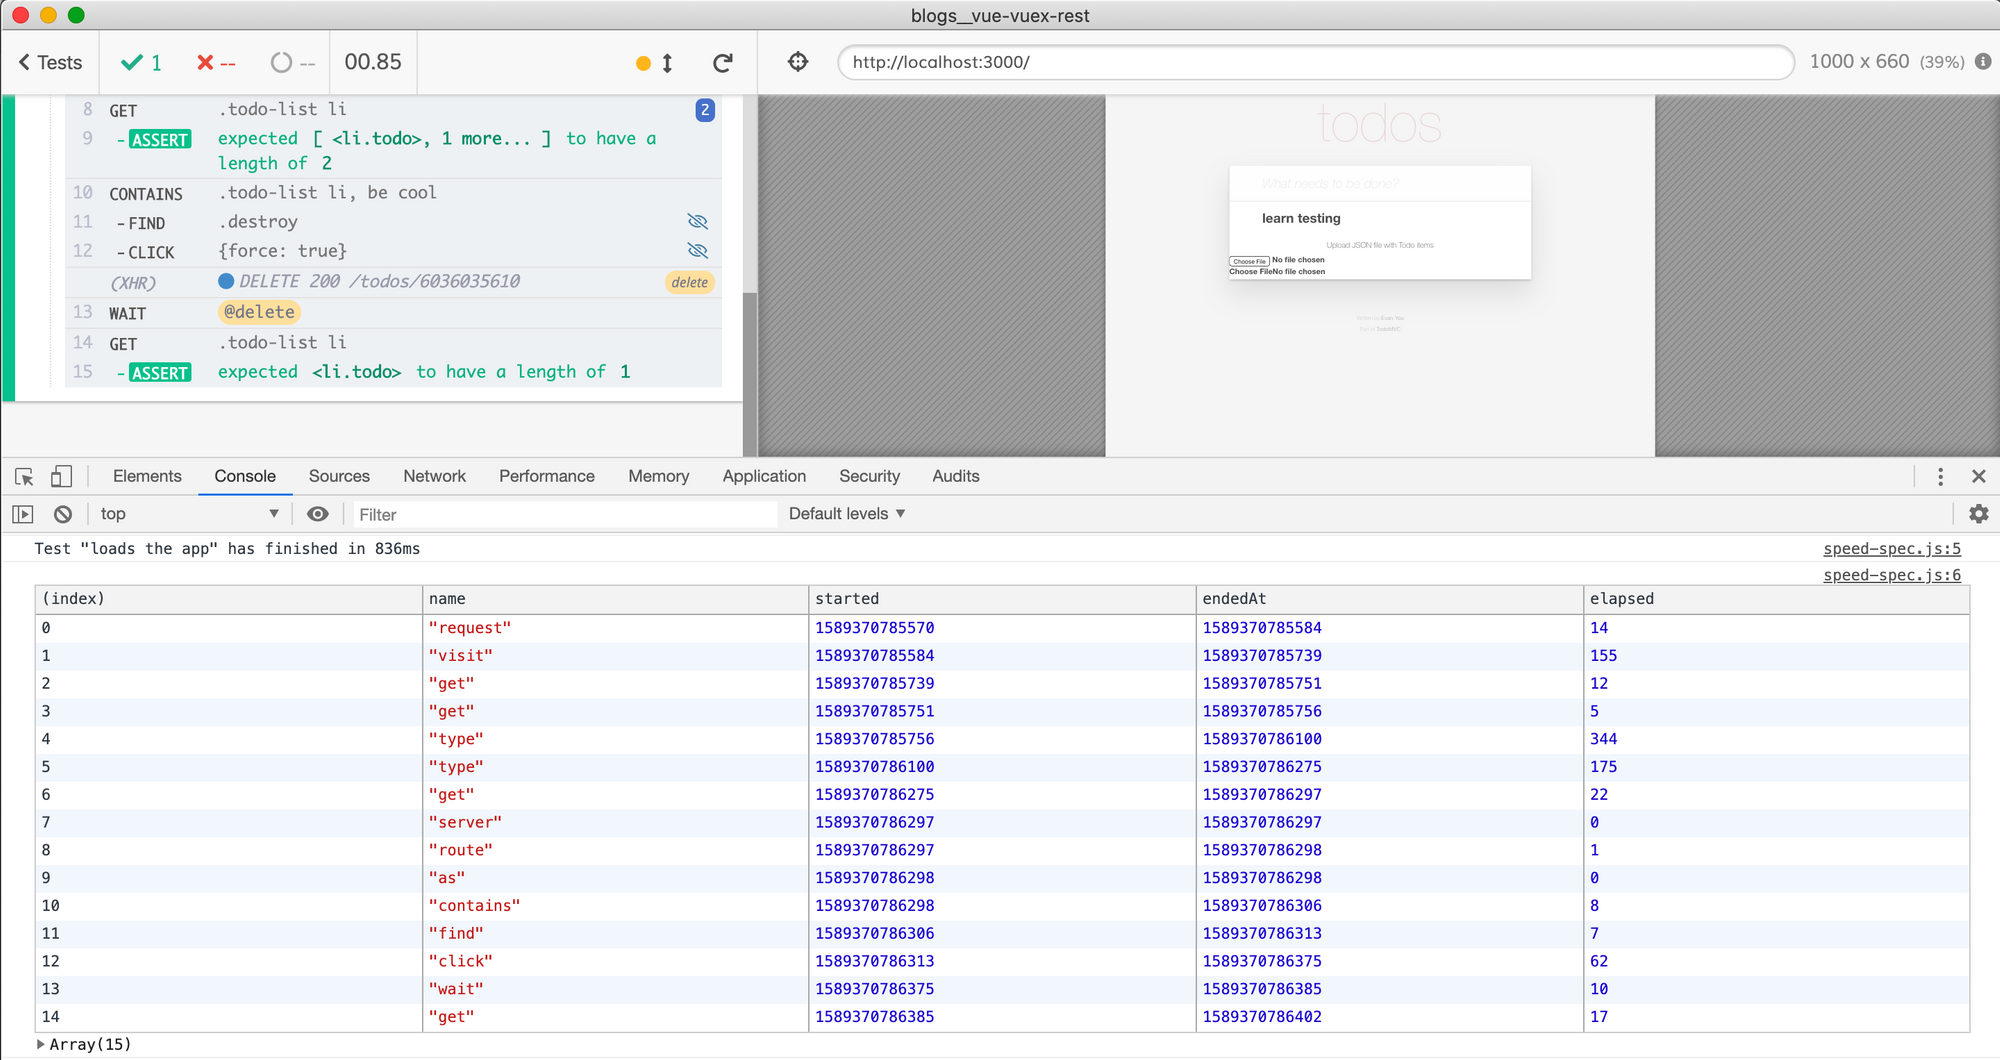
Let's look at the results. Visiting the local site takes 155ms - which is a lot, but that is what end-to-end tests must do, right? But then, there are a couple of surprises - 3 commands that are the real turtles: cy.type (twice) and cy.click (to remove the todo item)
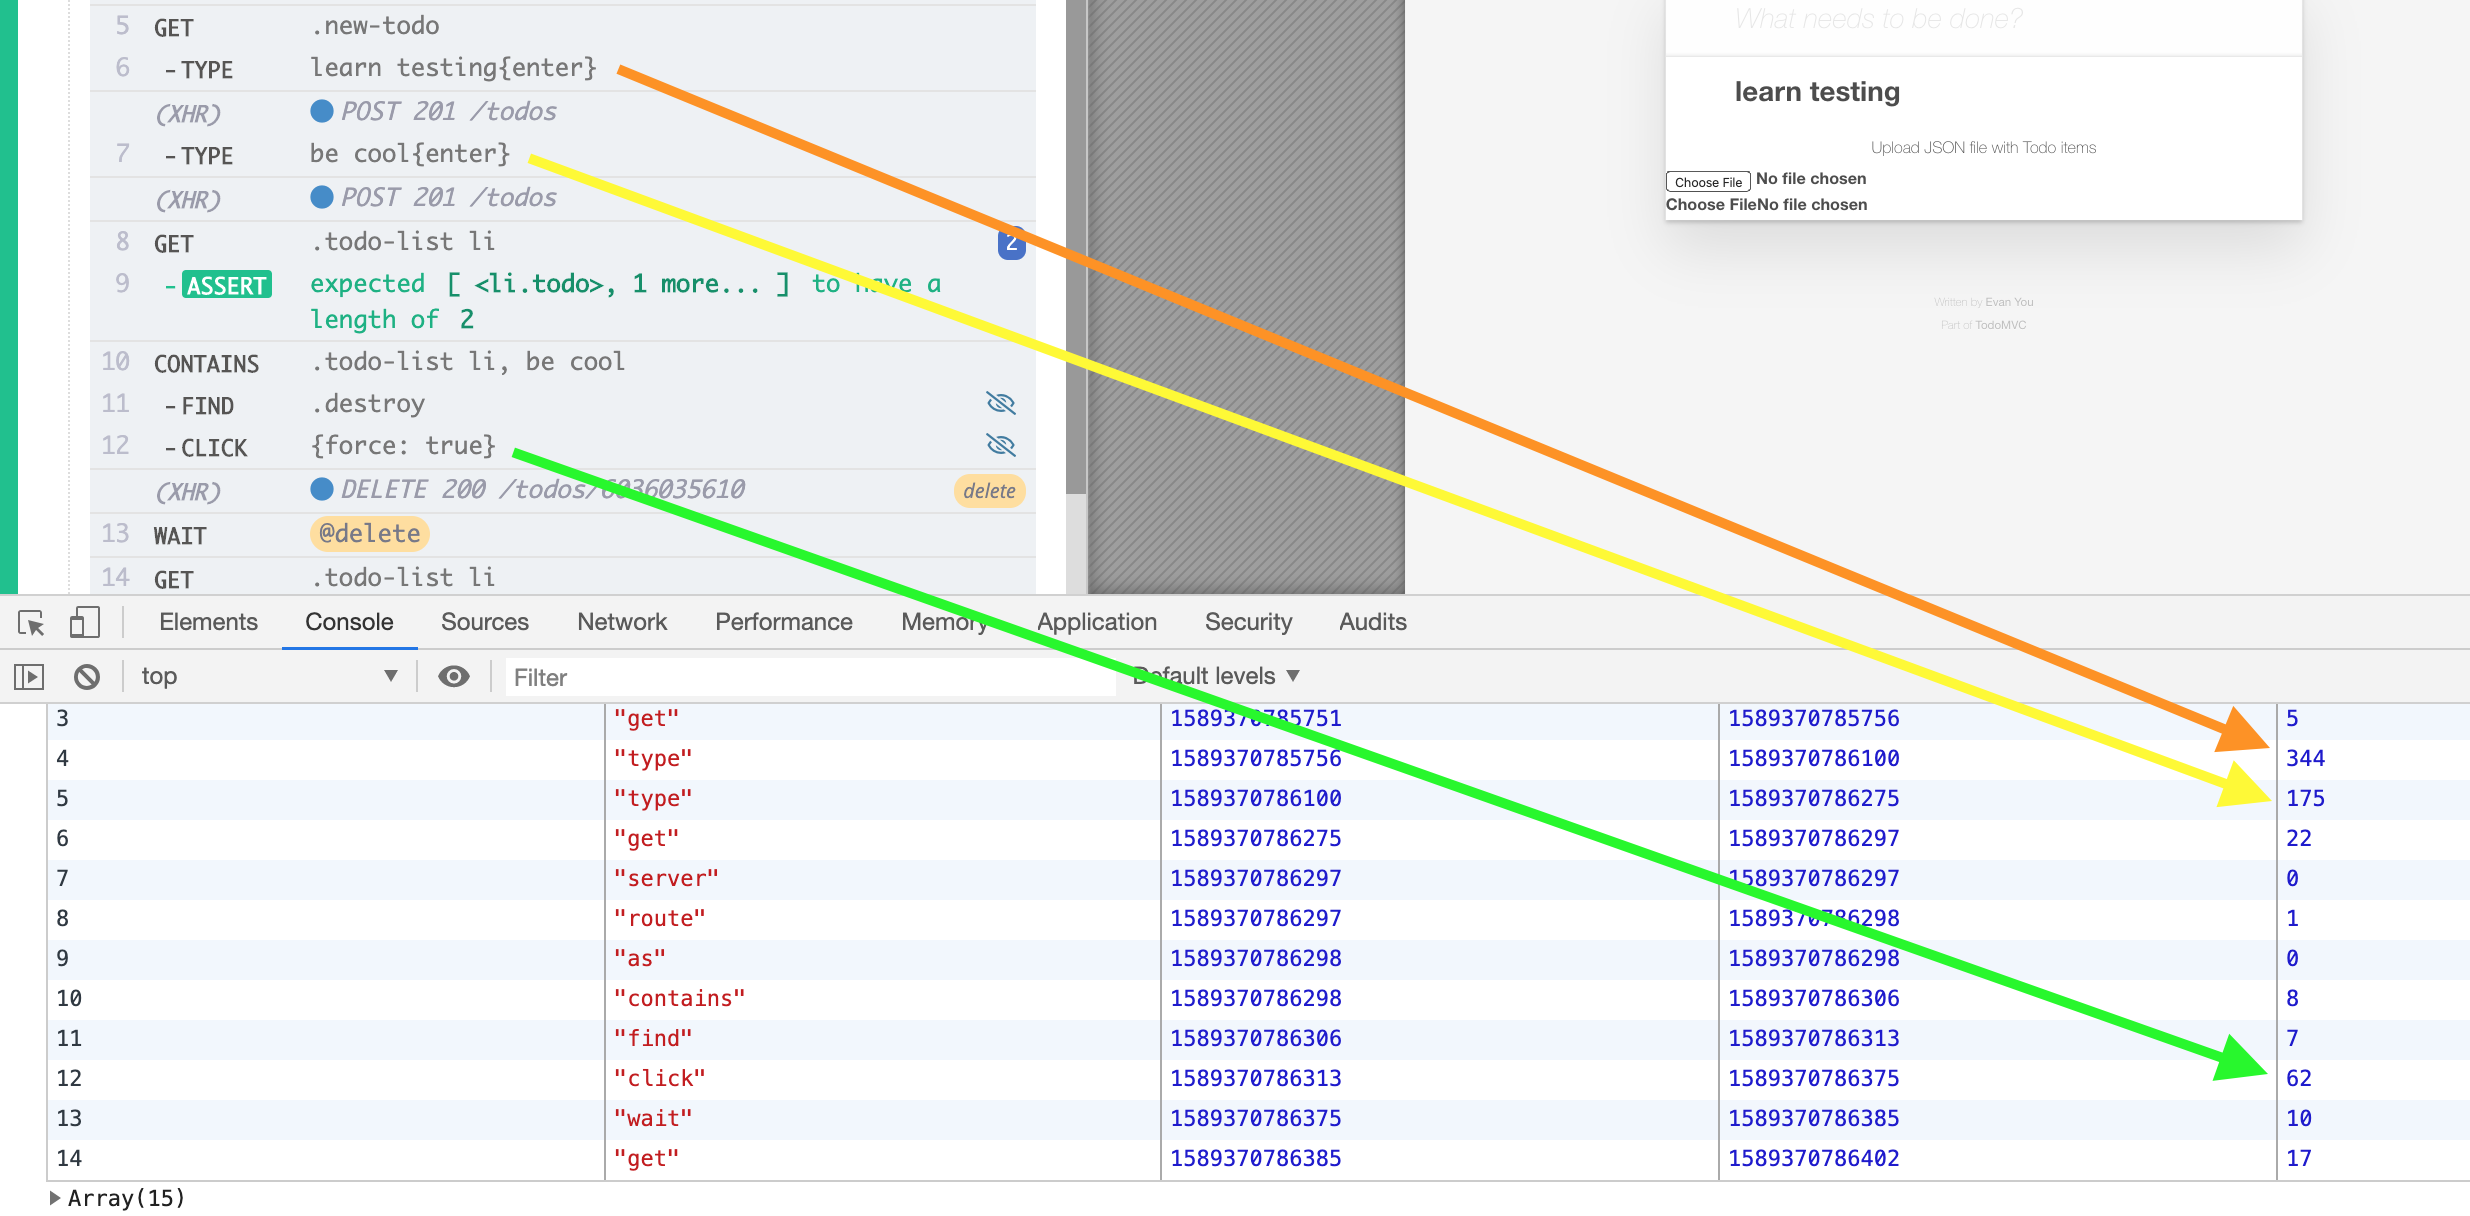
Taken together these commands take 344 + 175 + 62 = 581ms, about 70% of the test's total time! These commands are slow ... because they involve communication with the server. Notice the (XHR) messages in the Command Log under each command. Cypress Test Runner "notices" the network communication and DOM change immediately after each command and keeps a running "watch" before closing the command. This is how Cypress can show you the DOM snapshots before and after the command.
The Network
We can make these commands faster by stubbing the XHR communication. Note that there is a 4th XHR call - to load the initial list of Todos on application's load.
it('stubs the network calls', () => {
  // if we stub all network calls,
  // there is no need to reset the backend data

  // stub all network calls
  cy.server()
  // initially return an empty list of todos
  cy.route('GET', '/todos', [])
  cy.route('POST', '/todos', {})
  cy.route('DELETE', '/todos/*', {}).as('delete')

  // load the application
  cy.visit('/')
  cy.get('.todoapp').should('be.visible')

  // add several todo items
  cy.get('.new-todo')
  .type('learn testing{enter}')
  .type('be cool{enter}')

  cy.get('.todo-list li')
  .should('have.length', 2)

  // delete one item and confirm it was deleted
  cy.contains('.todo-list li', 'be cool').find('.destroy').click({ force: true })
  cy.wait('@delete')

  cy.get('.todo-list li')
  .should('have.length', 1)
})
The test above will never make a REST API call - we have stubbed the initial load, posting new items and deleting them. Let's see how the test flies now.
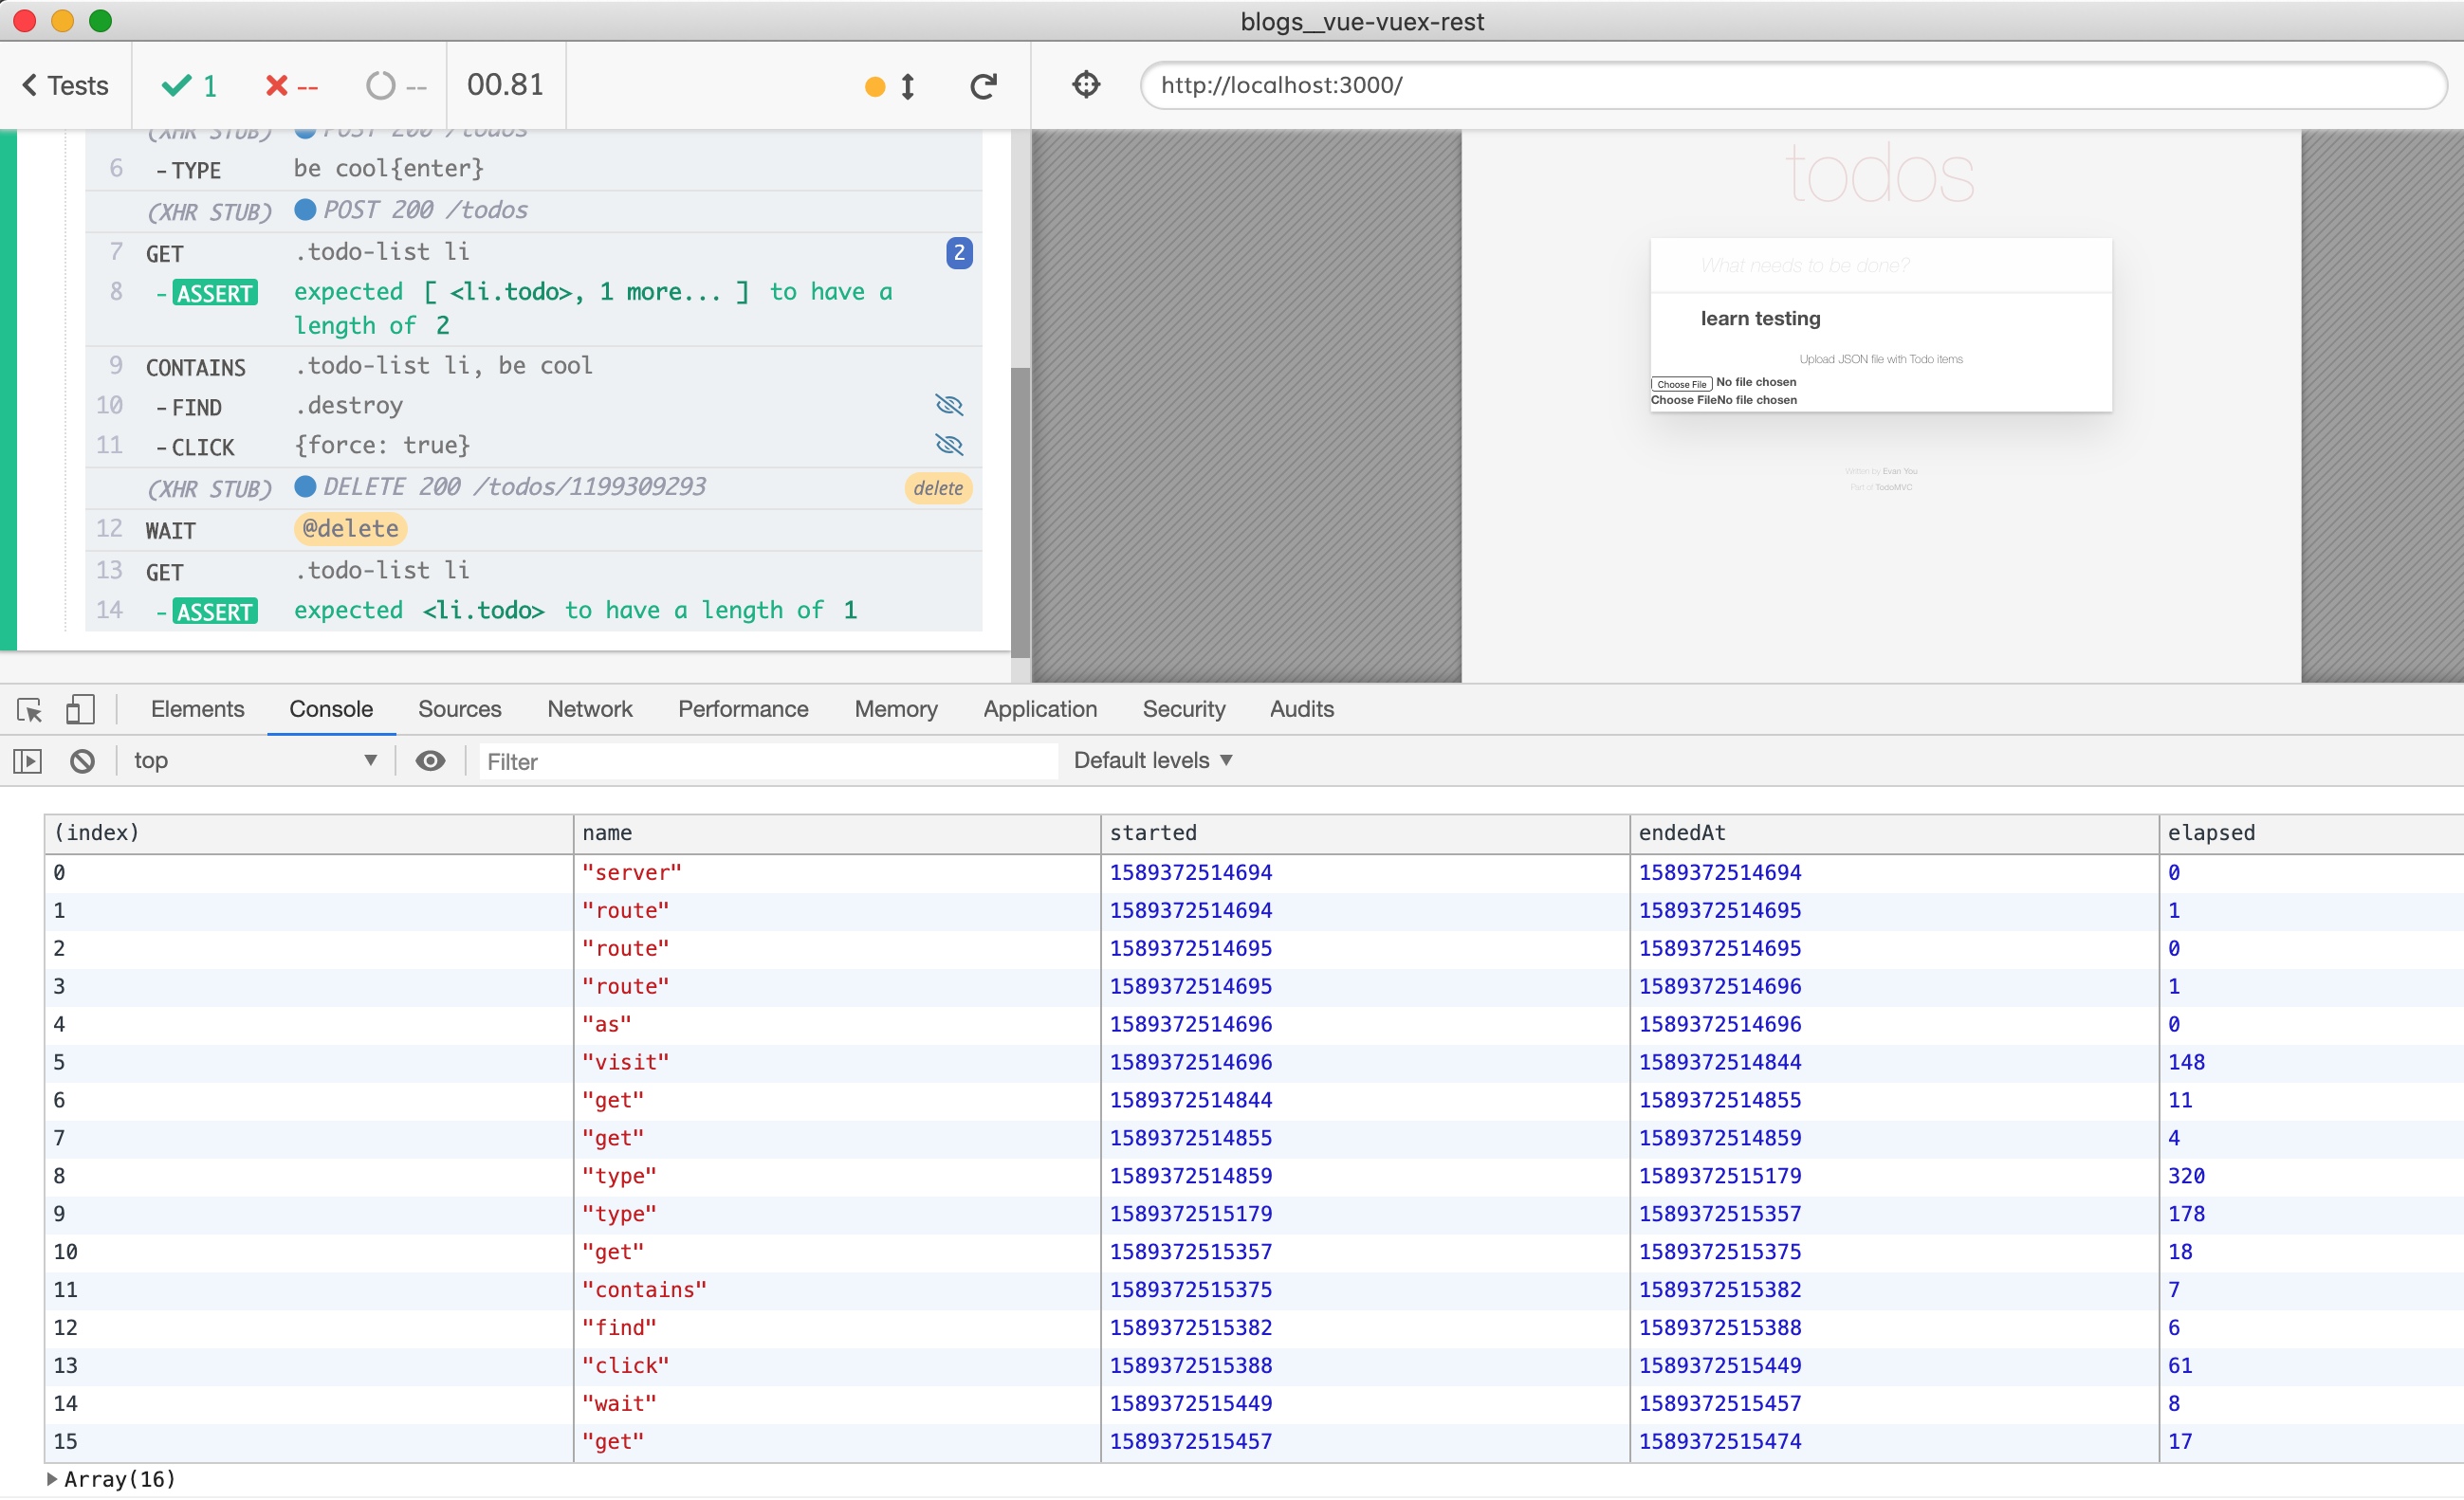
The test runs ... the same. This is surprising, because we assumed ... and that is the dangerous part. Never optimize anything without measuring it first, otherwise you might be chasing the wrong thing down the blind alley.
The Typing
There is one thing in the command durations that kind of stands out to me. The command cy.type('learn testing') takes about 320ms to execute, while the command cy.type('be cool') takes about half of that - 180ms. Is it a coincidence that learn testing has 13 characters and be cool has about half of that - 7 characters?
Yes - the length of the text matters when typing because Cypress sends an event for each letter. In fact it sends several events for each letter: keydown, keypress, textInput, input, and keyup. You can see those events by clicking on the "TYPE" in the Command Log and expanding the Keyboard Events table.
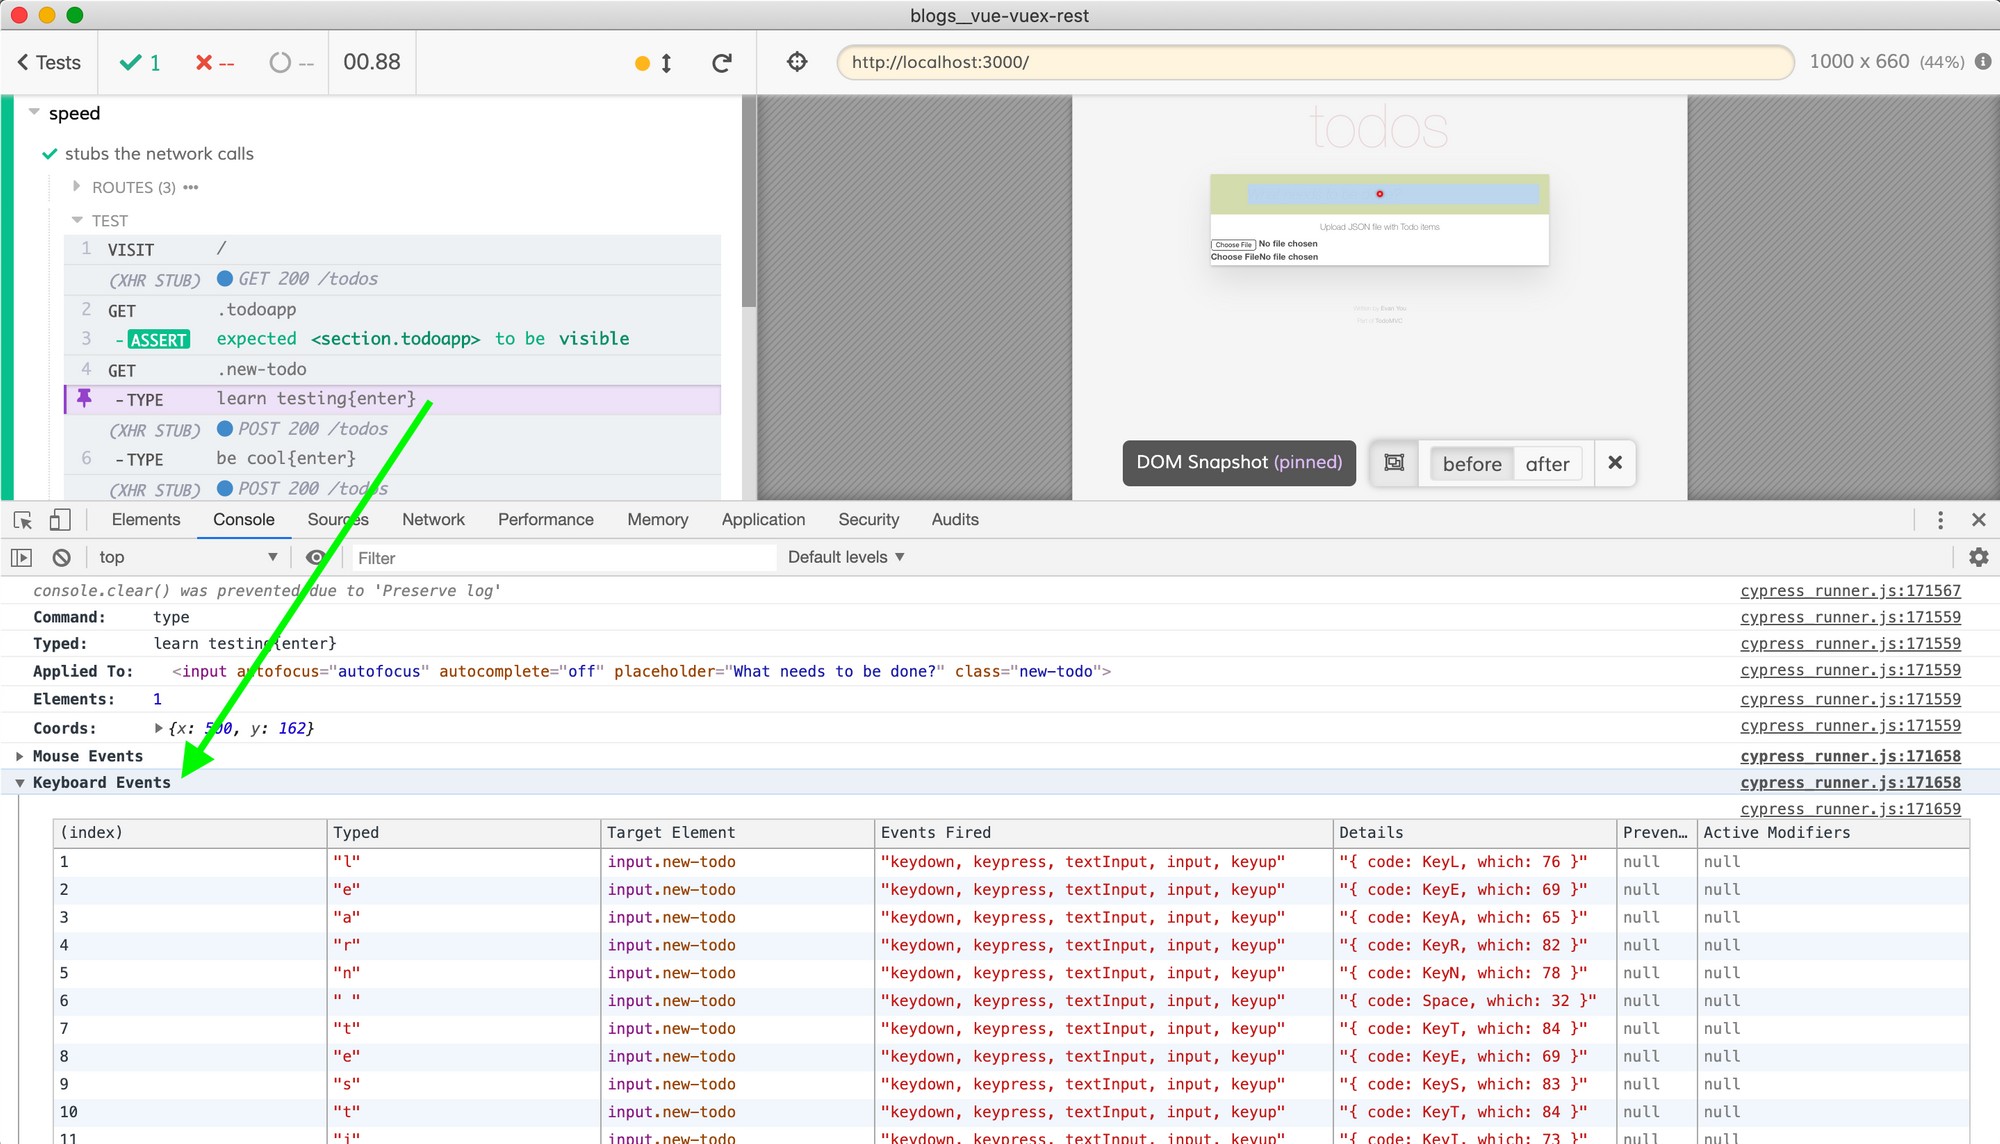
The more events Cypress sends, the longer the command takes. Let's shorten our test strings. I will also remove our network stubs - if they do not help with the speed, we might as well exercise the full stack.
We did cut the total time per cy.type command. But the second type command is still half the duration of the first type command. Again, let's go to the DevTools console and click on the first type command. Notice it has a mouse events table before the keyboard events table.
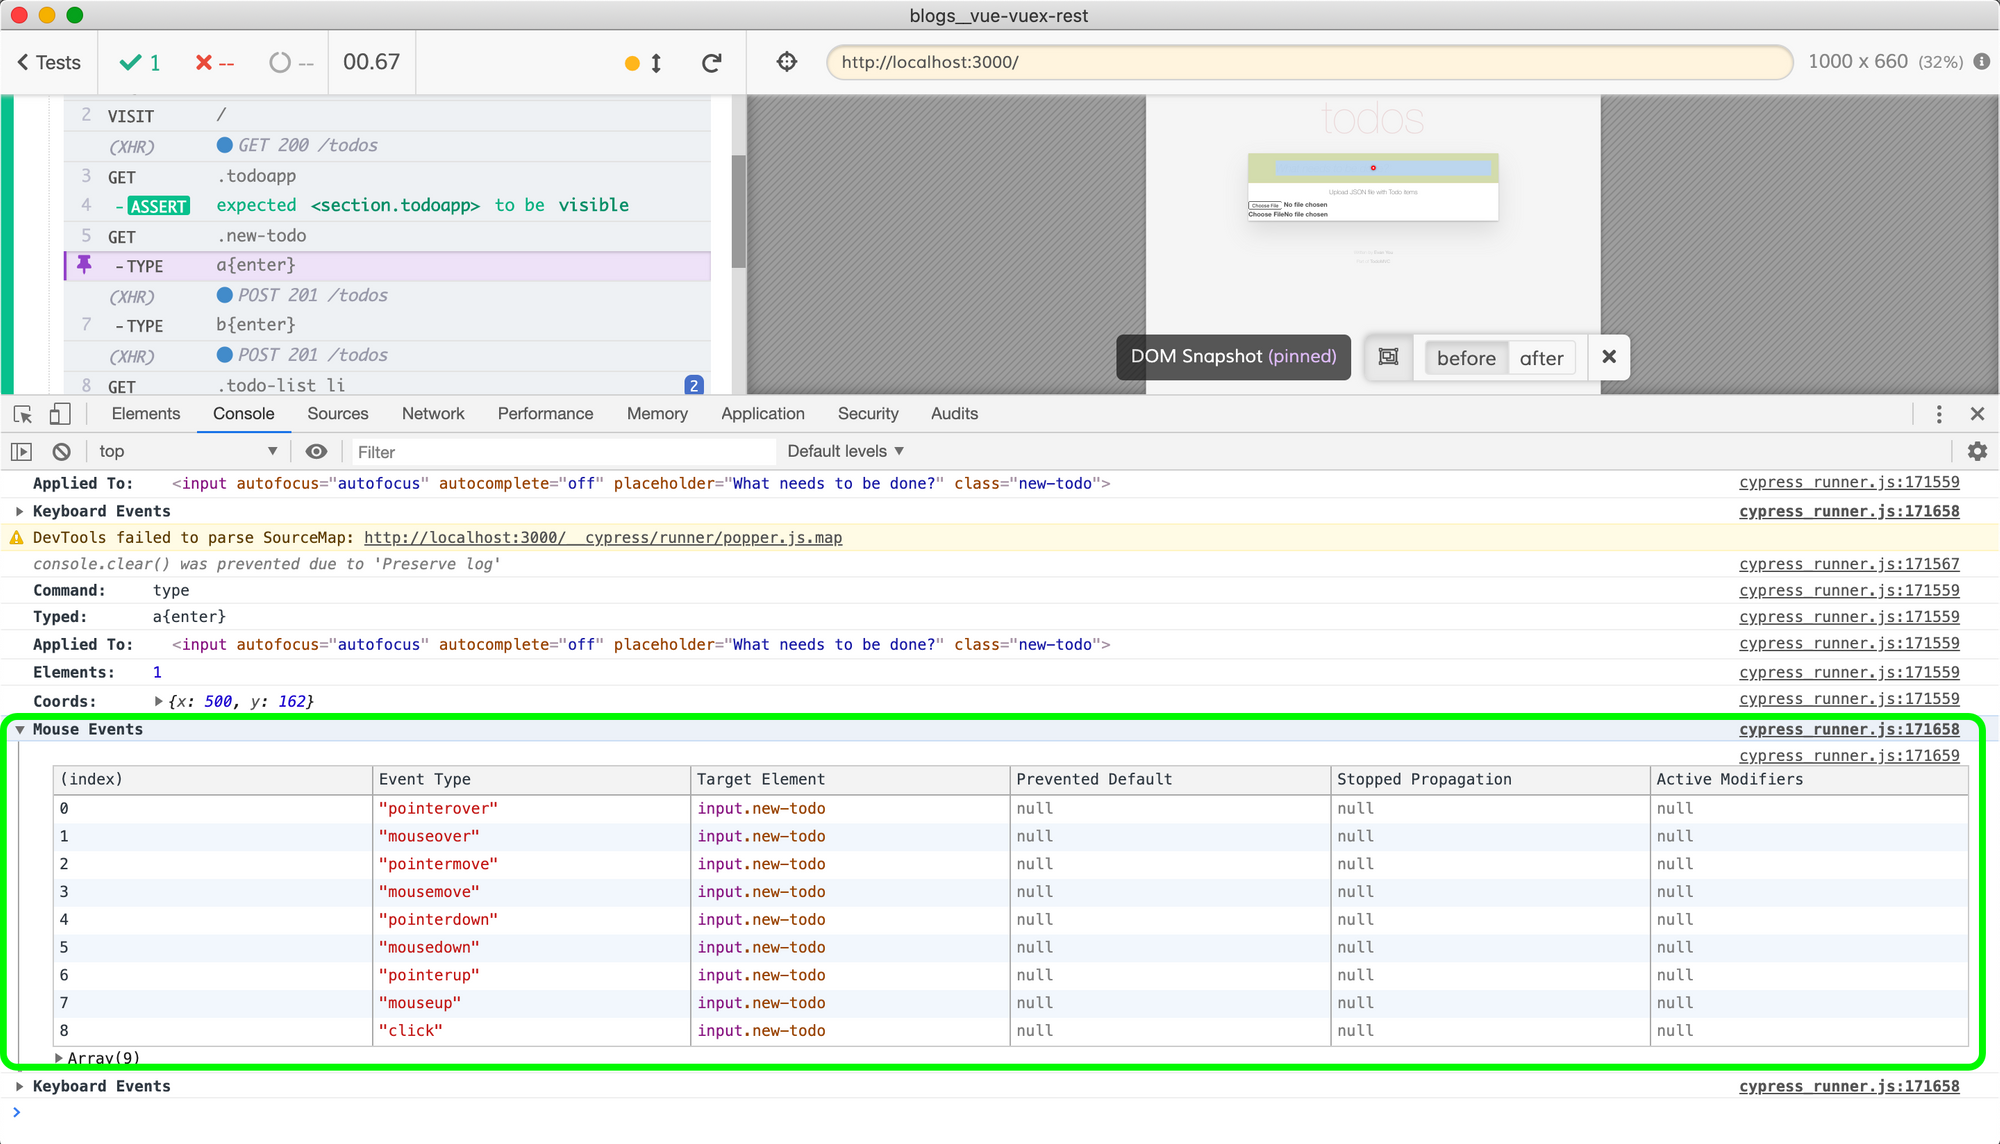
The second type command only has the keyboard events. As described in our `cy.type` documentation, before typing, Cypress checks if the element has focus, and if not sets the focus on the element. The extra time spent on the first type is due to the focus! We can make both commands run the same by sending the blur event in between them.
cy.get('.new-todo')
  .type('a{enter}')
  // force the next type to set focus again
  .blur()

cy.get('.new-todo')
  .type('b{enter}')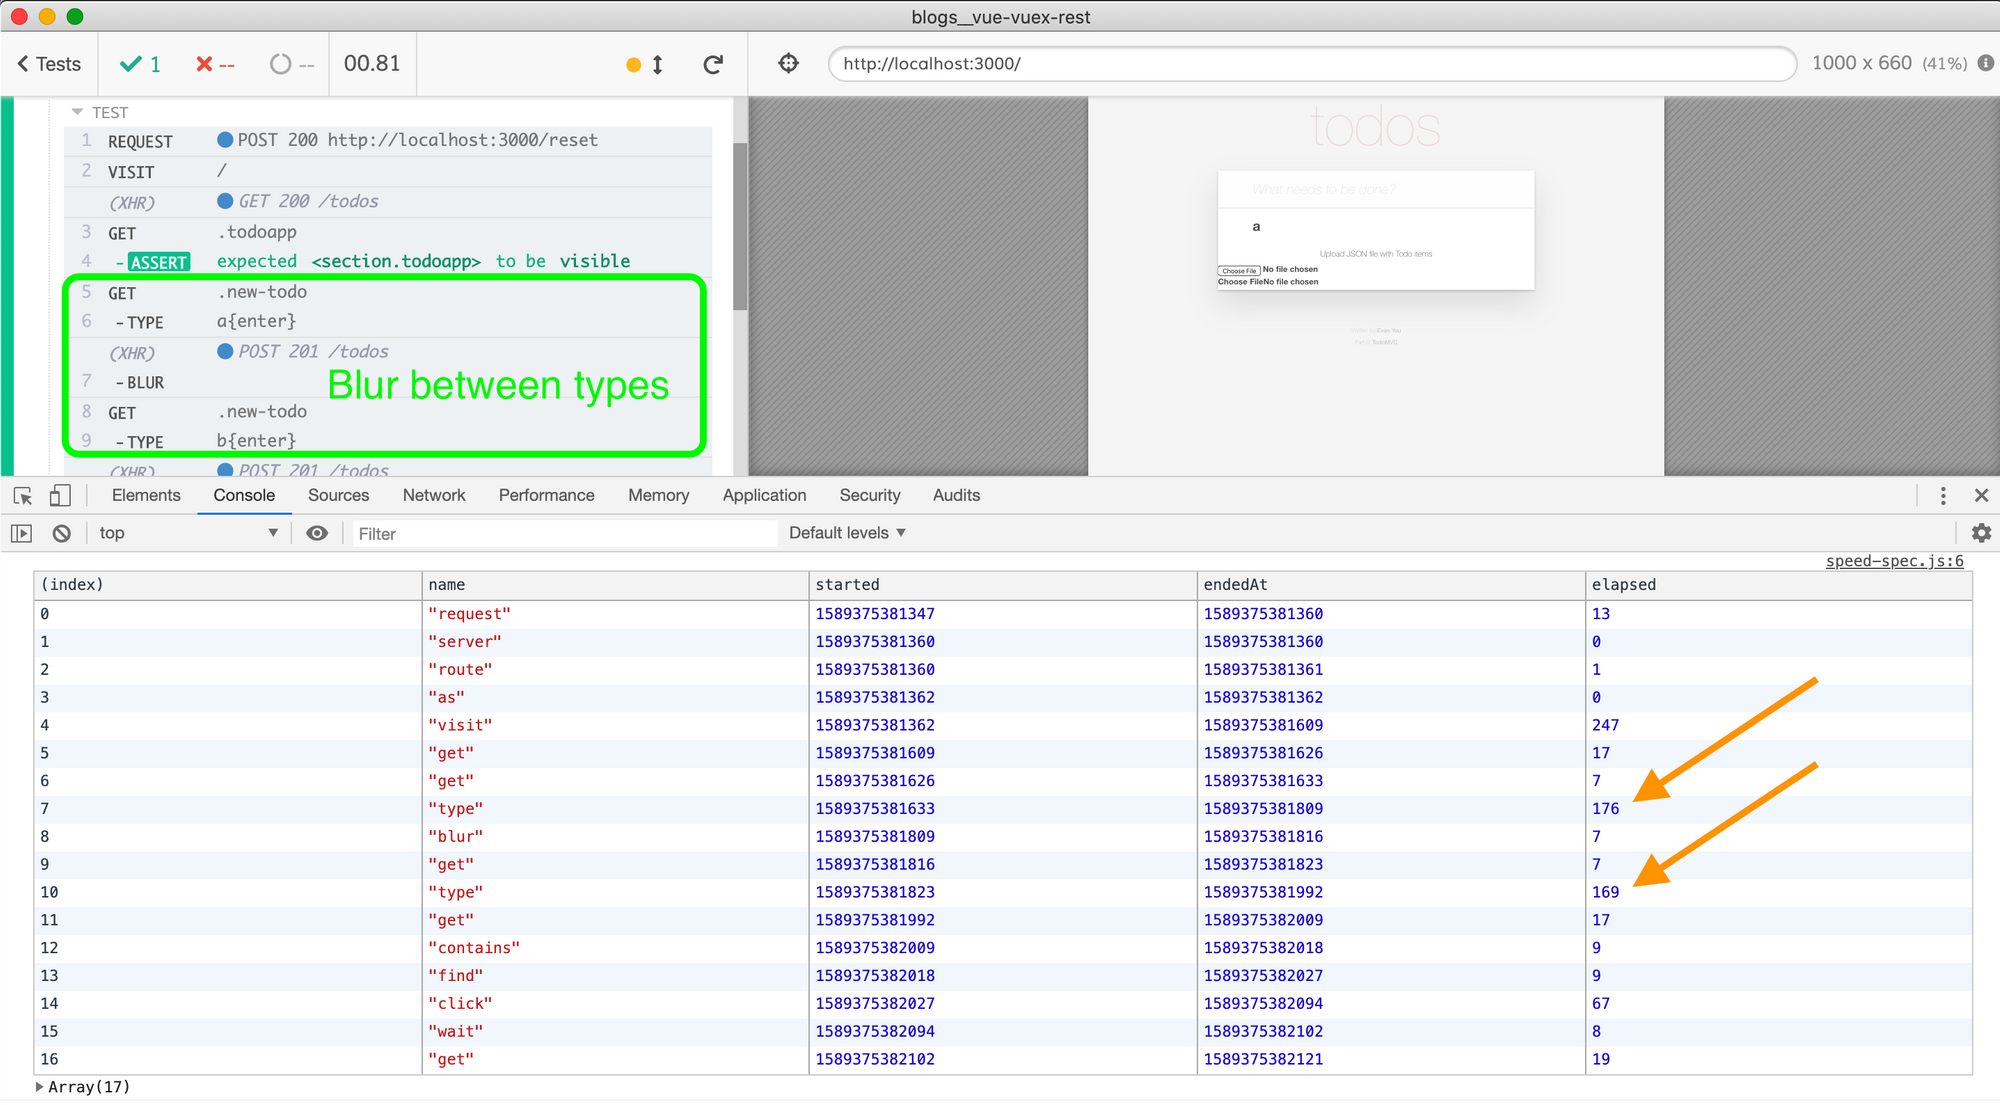
The Fixture
Now that we understand where the test is spending time and why, let's step back and rethink the big picture. What are we trying to confirm using this test? If this is the only test in our application, then it goes through the basic features of our application (loading the page, adding and deleting items), and in my opinion the test is fast enough.
However, if there are other tests already, then they probably already cover adding items and our test does not need to actually use cy.type to be able to test deleting an item.
Tip: using code coverage is a great way to see what the existing tests already cover.
Let's say that our test is focused on deleting todo items feature. Then we can set our data using a fixture file - and go directly to deleting an item.
it('deletes an item', () => {
  // reset the backend data using a fixture file
  cy.fixture('todos').then((todos) => {
    cy.request({
      method: 'POST',
      url: '/reset',
      body: {
        todos,
      },
    })
  })

  // spy on the application's XHR calls
  cy.server()
  cy.route('DELETE', '/todos/*').as('delete')

  // load the application
  cy.visit('/')
  cy.get('.todoapp').should('be.visible')

  cy.get('.todo-list li')
  .should('have.length', 2)

  // delete one item and confirm it was deleted
  cy.contains('.todo-list li', 'mock second')
    .find('.destroy').click({ force: true })
  cy.wait('@delete')

  cy.get('.todo-list li')
  .should('have.length', 1)
})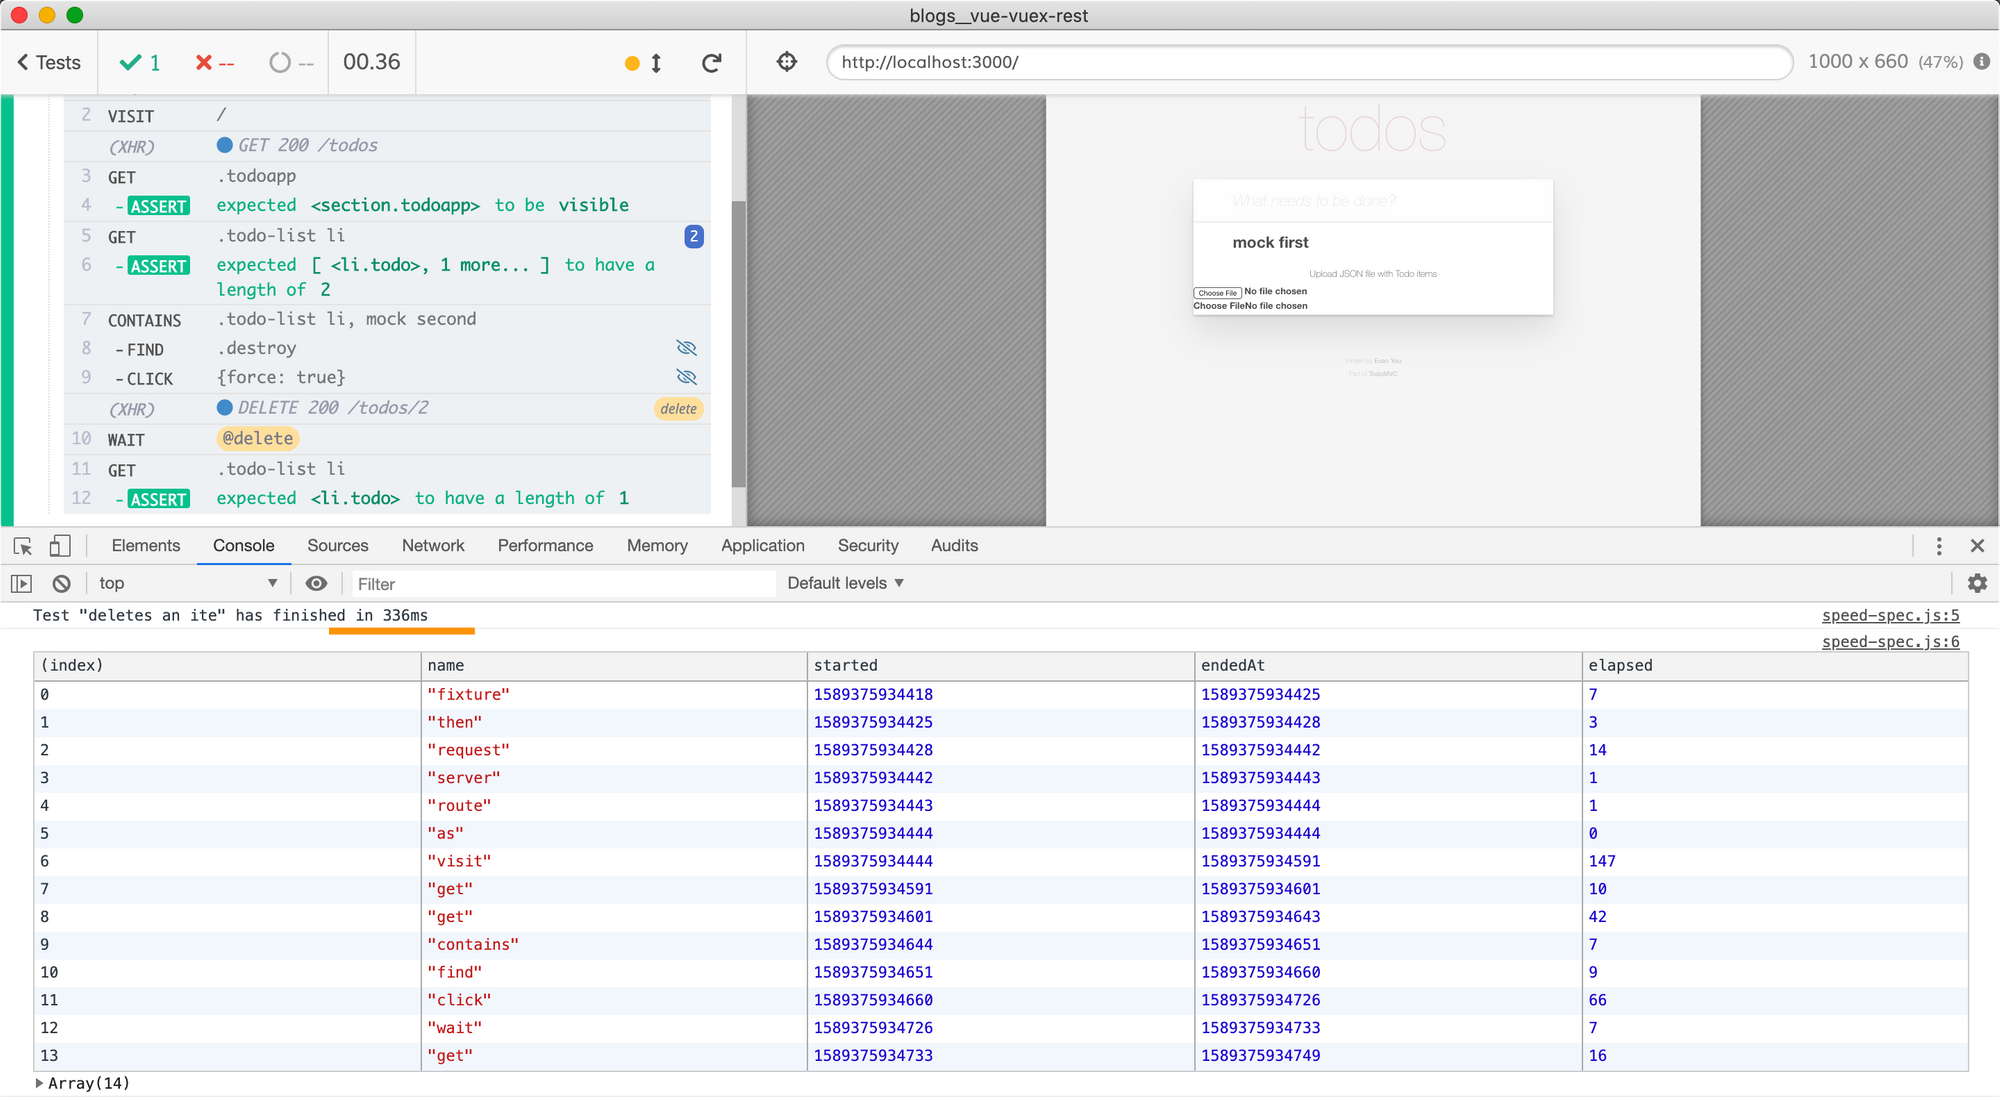
Perfect, the end-to-end test is fast and focused.
The Cypress Run
We have printed the test duration and command timings in the interactive cypress open mode. Let's print these numbers in the terminal so we can see them when using cypress run.
We need to collect all timing information in one place. Let's refactor our code a little bit and store test title, duration and commands in a single variable testAttributes.
let commands = []
let testAttributes

Cypress.on('test:before:run', () => {
  commands.length = 0
})

Cypress.on('test:after:run', (attributes) => {
  /* eslint-disable no-console */
  console.log('Test "%s" has finished in %dms',
    attributes.title, attributes.duration)
  console.table(commands)
  testAttributes = {
    title: attributes.title,
    duration: attributes.duration,
    commands: Cypress._.cloneDeep(commands),
  }
})
```
Our test runs in the browser and we want to print testAttributes in the terminal - thus we will need to use cy.task command to send this object from the browser process to the background process that runs in Node. We cannot run an asynchronous command from the test:after:run event hook, thus we will use separate "normal" Mocha hooks for that.
// sends test results to the plugins process
// using cy.task https://on.cypress.io/task
const sendTestTimings = () => {
  if (!testAttributes) {
    return
  }

  const attr = testAttributes
  testAttributes = null
  cy.task('testTimings', attr)
}

beforeEach(sendTestTimings)

after(sendTestTimings)
The combination of beforeEach and after ensures that the results of every time is sent "down" to the Node process. In cypress/plugins/index.js we can define a new task and print the table with results.
module.exports = (on, config) => {
  on('task', {
    testTimings (attributes) {
      console.log('Test "%s" has finished in %dms',
        attributes.title, attributes.duration)
      console.table(attributes.commands)

      return null
    },
  })
}
When the tests run, after each one you will see the timings
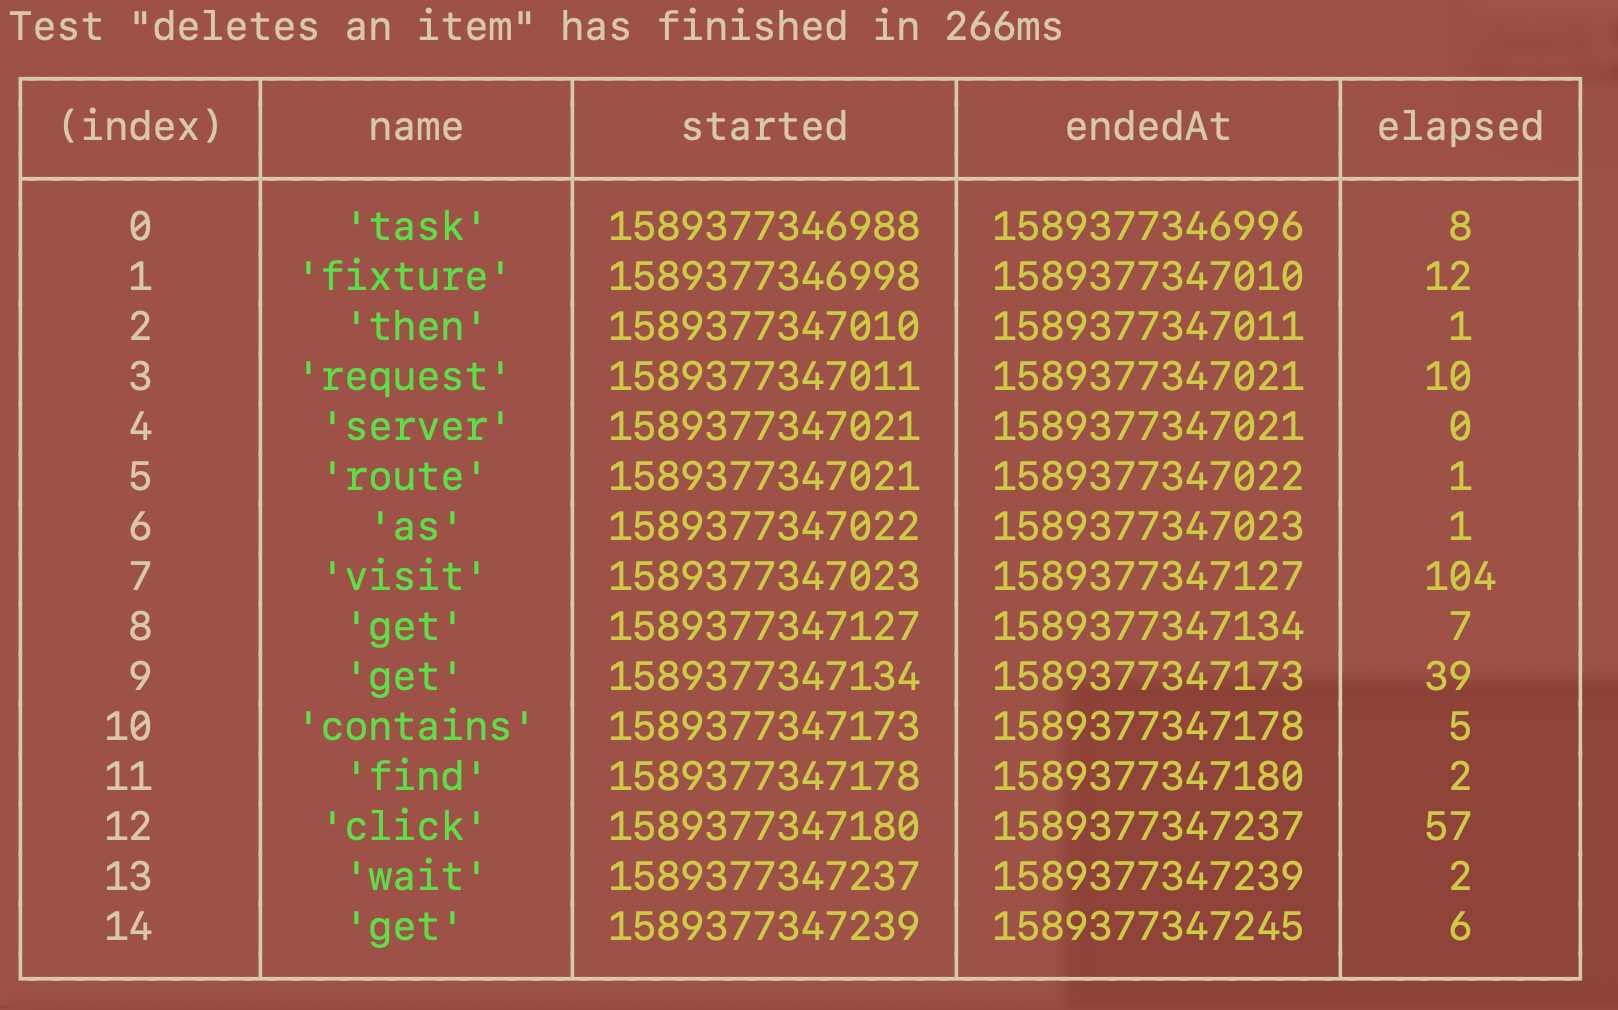
Perfect.
Happy (and fast) testing!