Starting with the inclusion of test error code frames in Cypress 4.6 in 2020, we have continued to improve Cypress’ ability to help developers with the debugging process. We’d be remiss if we built a testing framework and then didn’t do anything to help you with the issues it catches. Here are a few debugging best practices for using Cypress to help you write better code faster.
What is debugging in app development?
Debugging is the process of fixing the problems with the code that you’re writing. Thanks to Cypress, debugging can be done much earlier in the development process. By using both component testing and end-to-end (E2E) testing while developing your code, you can begin debugging the moment you’ve written your code, increasing productivity and efficiency. This shift towards greater agility is supported by Cypress, and this approach is the new standard for debugging best practices.
Reading failure messages in Cypress
One of the essential things a test framework must do well is the communication of error or test failure messages. For these messages to be useful, they must be highly readable and actionable. Cypress has always prioritized this experience by providing human-readable error messages and making the error stack trace easily accessible. Even with these features, the developer still has to map back the cause of the error to their source code to begin debugging.
To mitigate this additional step and speed up the debugging process, we've enhanced Cypress error messages to print useful information for finding and fixing the problem that caused a test to fail.
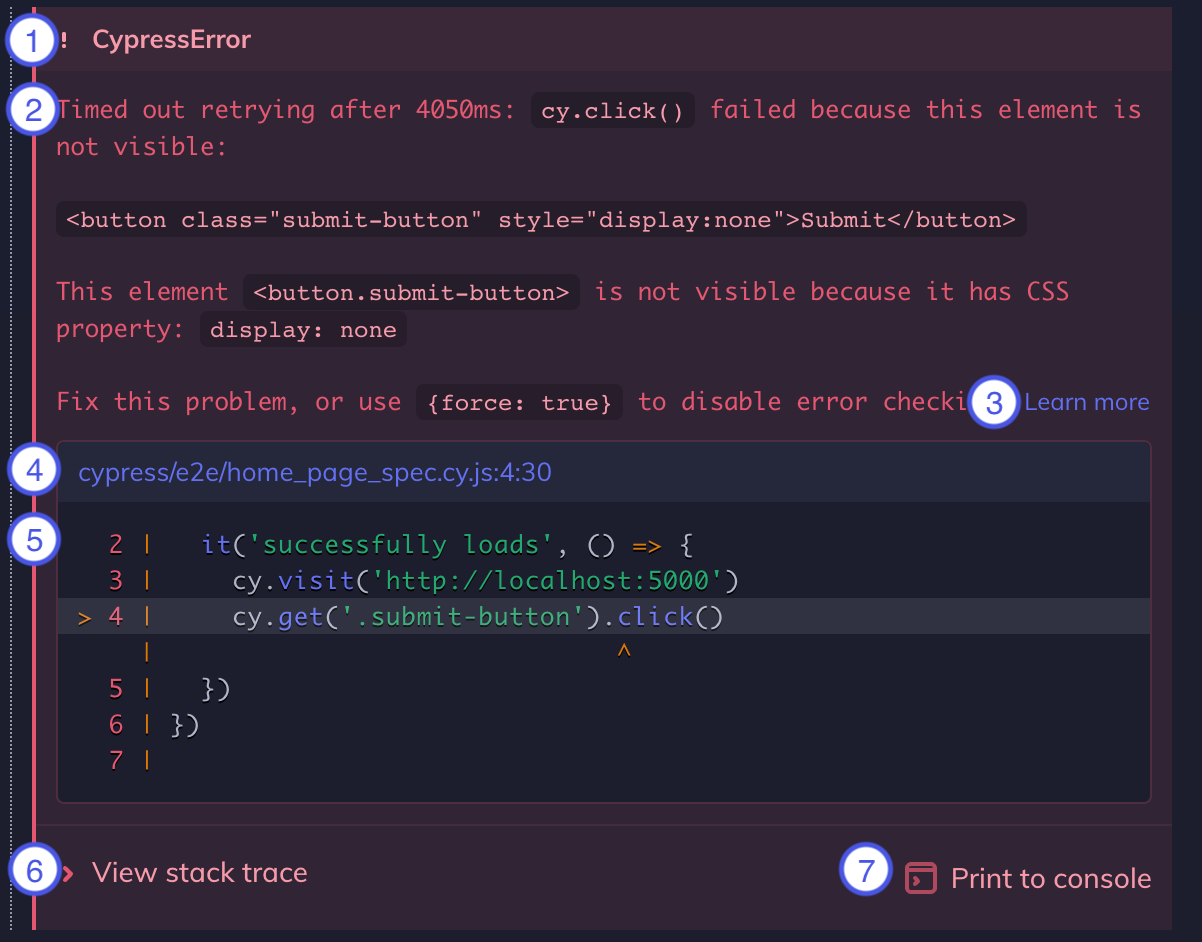
Above is an example of an error message resulting from a failed test in Cypress. Here are the items identified by number in the image:
- Error name: This is the type of error (e.g. AssertionError, CypressError)
- Error message: This generally tells you what went wrong. It can vary in length. Some are short like in the example, while some are long, and may tell you exactly how to fix the error.
- Learn more: Some error messages contain a Learn more link that will take you to relevant Cypress documentation.
- Code frame file: This is usually the top line of the stack trace and it shows the file, line number, and column number that is highlighted in the code frame below. Clicking on this link will open the file in your preferred file opener and highlight the line and column in editors that support it.
- Code frame: This shows a snippet of code where the failure occurred, with the relevant line and column highlighted.
- View stack trace: Clicking this toggles the visibility of the stack trace. Stack traces vary in length. Clicking on a blue file path will open the file in your preferred file opener.
- Print to console button: Click this to print the full error to your DevTools console. This will usually allow you to click on lines in the stack trace and open files in your DevTools.
The code frame snippet previews the exact line of code that caused an error and provides a quick context around the problem-point. Once you're ready to take action or a more in-depth look, the code frame link takes you directly to the line and column of the error source within your desired code editor.
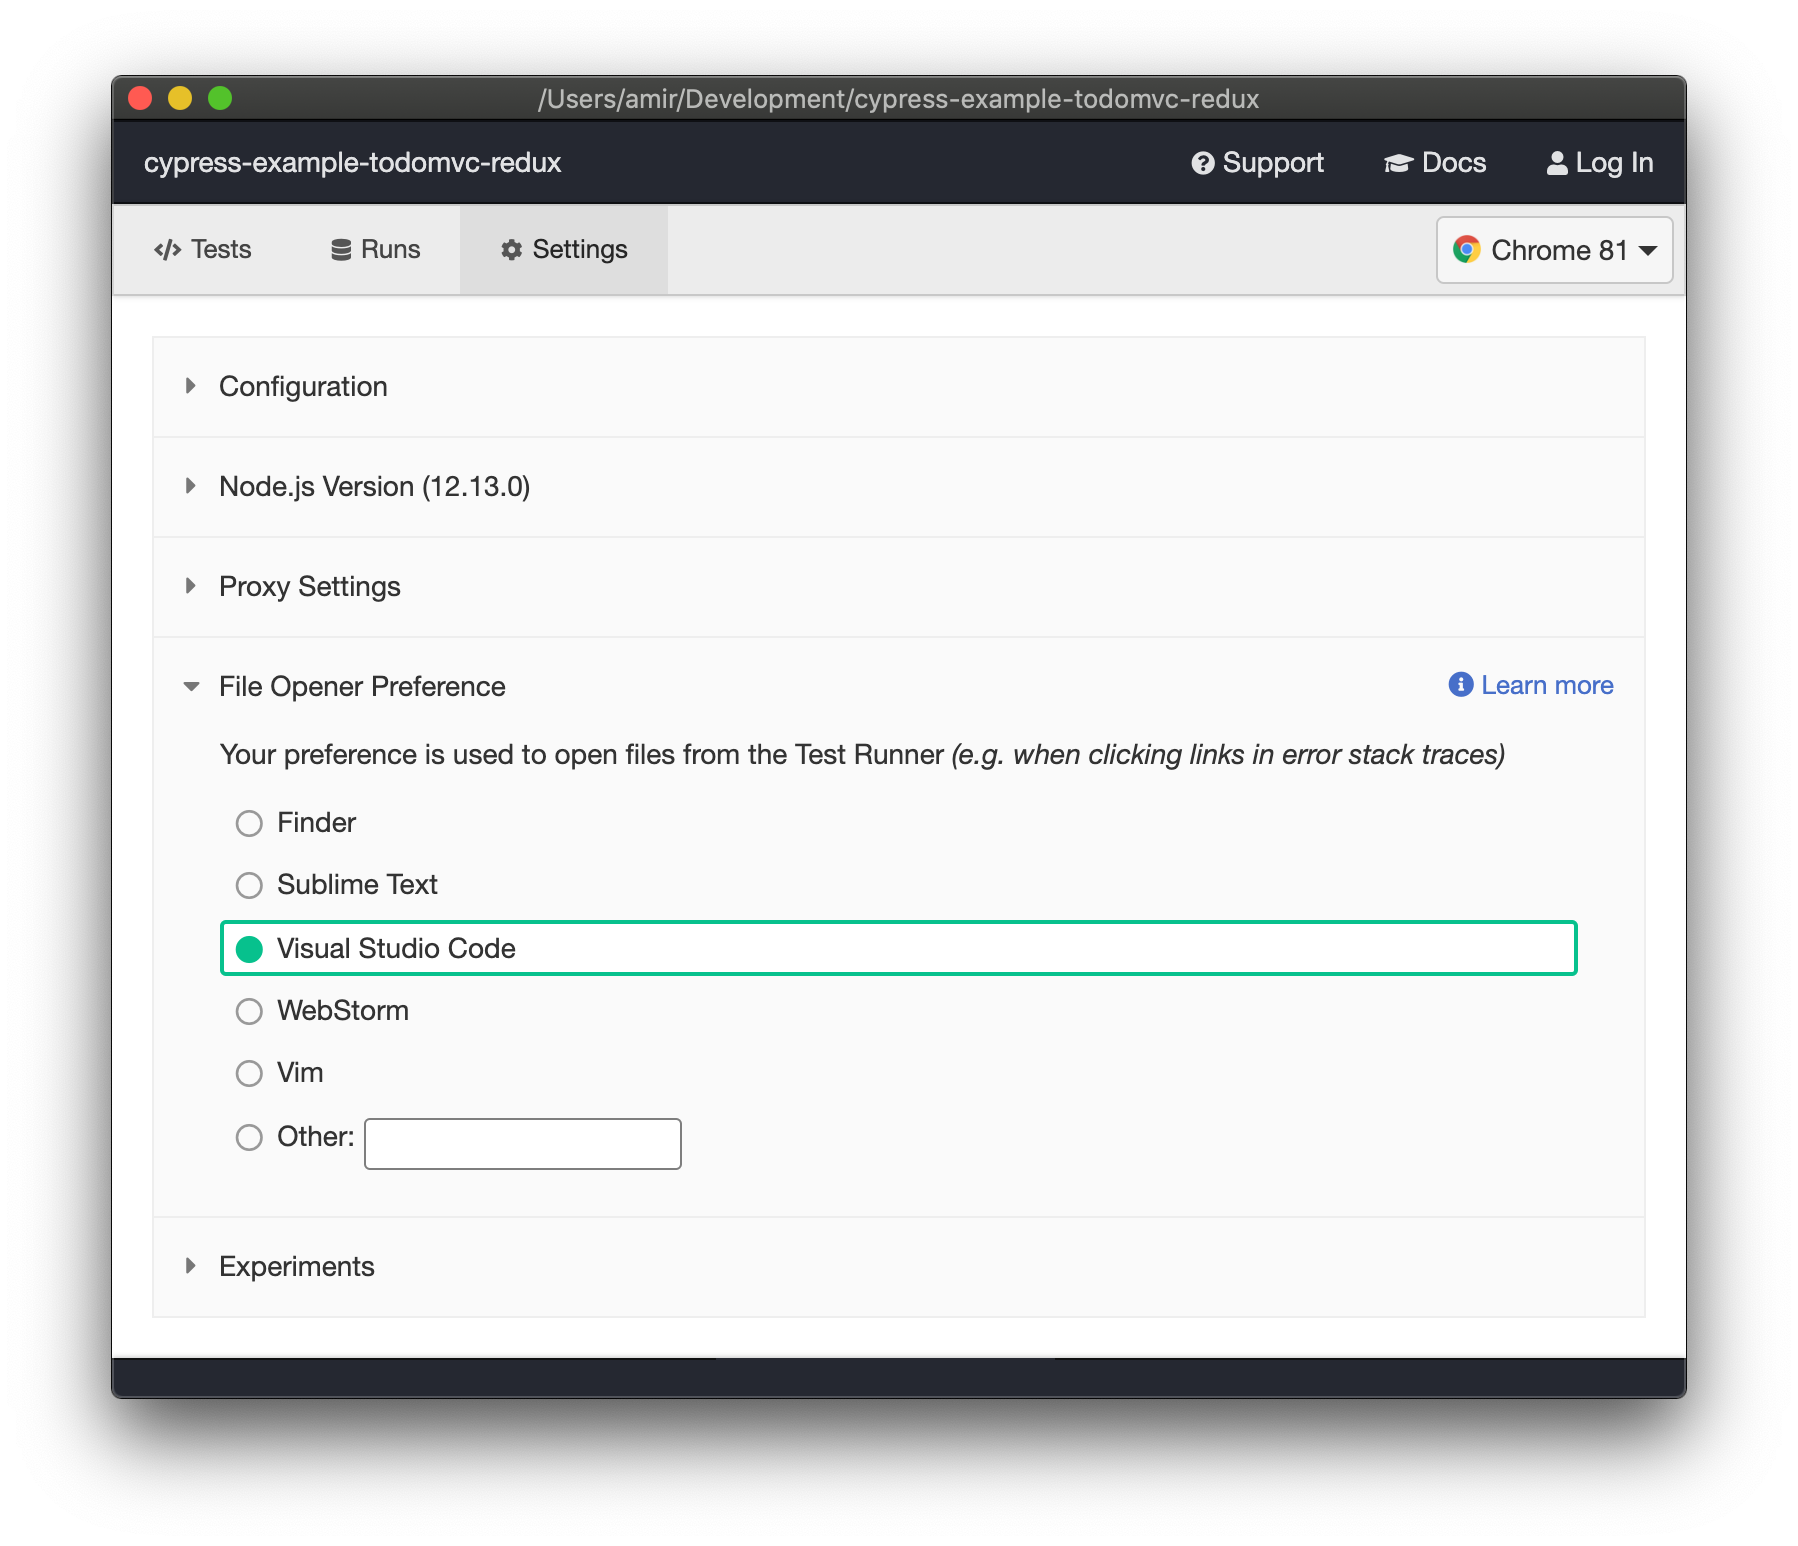
When you use a code frame link for the first time, Cypress will prompt you to select your desired file opener. Popular editors like VS Code, Sublime Text, Vim, and WebStorm are supported out-of-the-box, and you can configure any other editor that supports inline highlighting of files. This configuration can always be changed in the Cypress settings section, and you can learn more about it within the File Opener Preference docs.
Cypress includes inline source maps to provide useful stack traces and code frames. If you use a modified preprocessor, please ensure that you are generating inline source maps to get the best error message experience. Read more about this in our Debugging guide.
Since the launch of error message improvements in Cypress 4.6, we have minimized the time-gap between error discovery and resolution and are a part of our ongoing effort to deliver the best-in-class developer experience.
Test your code, not your patience with Cypress app
Install Cypress in seconds on Mac, Linux, or Windows and embrace the future of testing modern applications. With Cypress, you can easily add testing and debugging to your development process in an agile, intuitive way.