I have no patience waiting for a lot of Cypress end-to-end tests to finish running on CI. Just sitting and waiting … staring at the CI badge. Any run taking longer than a minute feels like an eternity. Our Cypress development team felt this pain and decided to do something about it. Today we have a solution that slashes those waiting periods - it is automatic test file load balancing across multiple CI machines using a single --parallel flag.
Load Balancing
By default cypress run command executes every found spec serially. Even if you can easily allocate more CI machines to run your end-to-end, each machine runs through the same spec files. You can manually select which tests to execute on different CI machines, but that requires fiddling with the CI scripts and constantly adjusting them: an added or removed spec file breaks the entire setup. I know the pain because I wrote multi-cypress that generates a custom GitLab CI file based on found specs - and it definitely was a pain to worry about in my day to day work.
Starting with Cypress v3.1.0 you can let Cypress select which tests to run on each CI machine - quickly splitting the entire spec list among them. The best thing about this? For most CI providers it will just require adding a single CLI option to the cypress run command! Read the parallelization docs or take a look at code below which works for Circle CI
jobs:
  # give any name to job
  4x-electron:
    # use Cypress built Docker image with Node 10 and npm 6
    docker:
      - image: cypress/base:10
    # tells CircleCI to execute this job on 4 machines simultaneously
    parallelism: 4
    steps:
      - checkout
      # note: omitting caching for brevity
      # quickly install NPM dependencies
      - npm ci
      # load balance all tests across 4 CI machines
      - $(npm bin)/cypress run --parallel
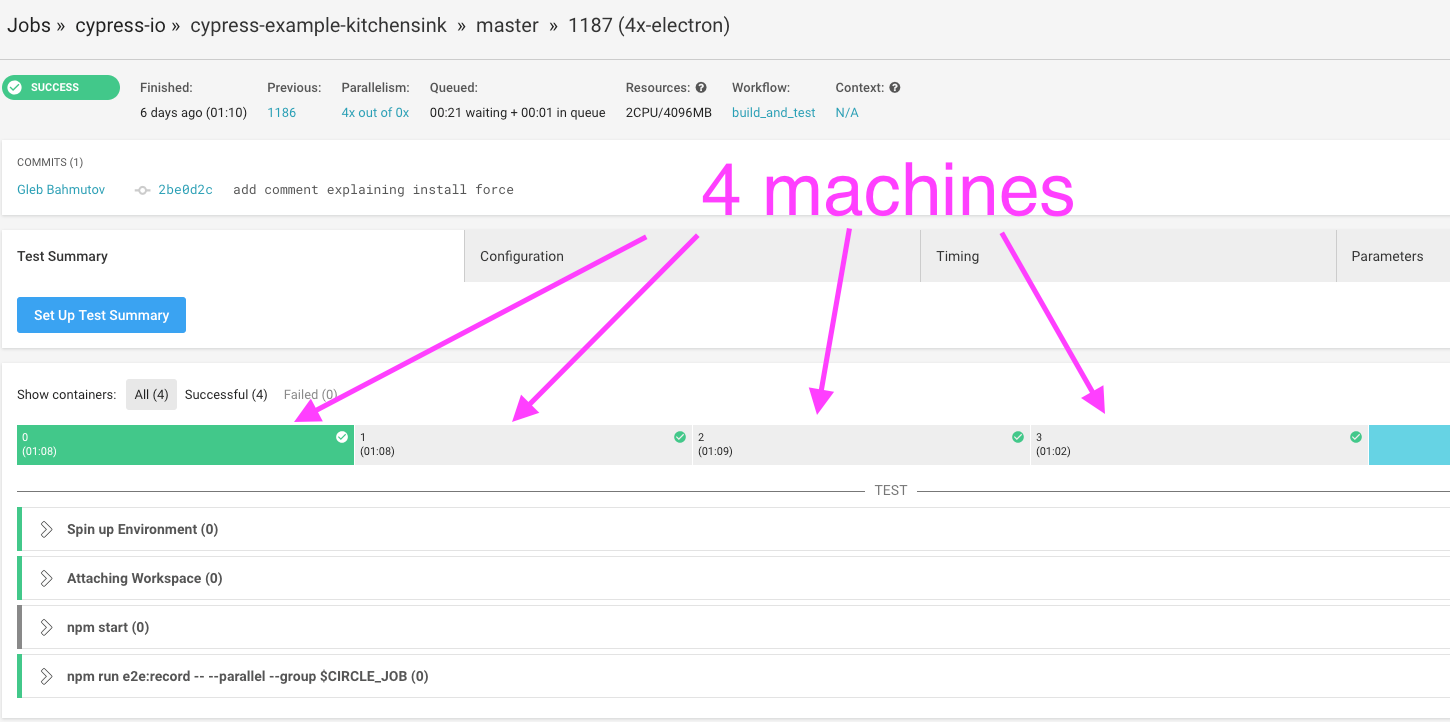
You can find the full CI file (as well as config files for other providers) in our cypress-example-kitchensink repository. You can see the CI output for example at circleci.com/gh/cypress-io/cypress-example-kitchensink/1187, here is this job executed on 4 machines.

If you look at the standard output from any machine, it will look quite different from the output from previous Cypress versions. Here is the start of one machine’s output
> cypress run --record "--parallel" "--group" "4x-electron"


====================================================================================================

  (Run Starting)

  ┌────────────────────────────────────────────────────────────────────────────────────────────────┐
  │ Cypress:    3.1.0                                                                              │
  │ Browser:    Electron 59 (headless)                                                             │
  │ Specs:      19 found (examples/actions.spec.js, examples/aliasing.spec.js, examples/assertion… │
  │ Params:     Group: 4x-electron, Parallel: true                                                 │
  │ Run URL:    https://dashboard.cypress.io/#/projects/4b7344/runs/2320                           │
  └────────────────────────────────────────────────────────────────────────────────────────────────┘


────────────────────────────────────────────────────────────────────────────────────────────────────

  Running: examples/actions.spec.js...                                                    (1 of 19)
  Estimated: 16 seconds


  Actions
    ✓ .type() - type into a DOM element (4110ms)
    ✓ .focus() - focus on a DOM element (299ms)
    ✓ .blur() - blur off a DOM element (504ms)
    ✓ .clear() - clears an input or textarea element (649ms)
    ✓ .submit() - submit a form (623ms)
    ✓ .click() - click on a DOM element (2258ms)
    ✓ .dblclick() - double click on a DOM element (300ms)
    ✓ .check() - check a checkbox or radio element (1084ms)
    ✓ .uncheck() - uncheck a checkbox element (1031ms)
    ✓ .select() - select an option in a select element (1014ms)
    ✓ .scrollIntoView() - scroll an element into view (295ms)
    ✓ .trigger() - trigger an event on a DOM element (267ms)
    ✓ cy.scrollTo() - scroll the window or element to a position (2233ms)


  13 passing (16s)


  (Results)

  ┌────────────────────────────────────────┐
  │ Tests:        13                       │
  │ Passing:      13                       │
  │ Failing:      0                        │
  │ Pending:      0                        │
  │ Skipped:      0                        │
  │ Screenshots:  0                        │
  │ Video:        true                     │
  │ Duration:     16 seconds               │
  │ Estimated:    16 seconds               │
  │ Spec Ran:     examples/actions.spec.js │
  └────────────────────────────────────────┘

  ... skip some output ...

  (Run Finished)


      Spec                                                Tests  Passing  Failing  Pending  Skipped
  ┌────────────────────────────────────────────────────────────────────────────────────────────────┐
  │ ✔ examples/actions.spec.js                  00:16       13       13        -        -        - │
  ├────────────────────────────────────────────────────────────────────────────────────────────────┤
  │ ✔ examples/utilities.spec.js                00:04        6        6        -        -        - │
  ├────────────────────────────────────────────────────────────────────────────────────────────────┤
  │ ✔ examples/files.spec.js                    00:02        3        3        -        -        - │
  ├────────────────────────────────────────────────────────────────────────────────────────────────┤
  │ ✔ examples/querying.spec.js                 00:02        4        4        -        -        - │
  ├────────────────────────────────────────────────────────────────────────────────────────────────┤
  │ ✔ examples/location.spec.js                 00:02        3        3        -        -        - │
  └────────────────────────────────────────────────────────────────────────────────────────────────┘
    All specs passed!                           00:28       29       29        -        -        -


───────────────────────────────────────────────────────────────────────────────────────────────────────

  Recorded Run: https://dashboard.cypress.io/#/projects/4b7344/runs/2320
Note that this machine found 19 spec files, but executed only 5 specs before the run was completed - the other specs were executed by the other CI machines. Also, note how there was an estimated time duration for each spec - we use previous running times for each spec to order them. By putting longer specs first, we can achieve faster completion times, because a single long spec is less likely to slow down one of the machines while the other machines have already finished shorter specs.
The Dashboard
The automatic load balancing is only possible if there is a central service that can coordinate multiple Cypress test runners. The Cypress Dashboard acts as this coordinator; it has the previous spec file timings so it can tell each machine what to execute next and when the entire run finishes. Each test runner prints the dashboard run url when it starts and finishes. In the above example, I will open https://dashboard.cypress.io/#/projects/4b7344/runs/2320 to see how the spec files ran.

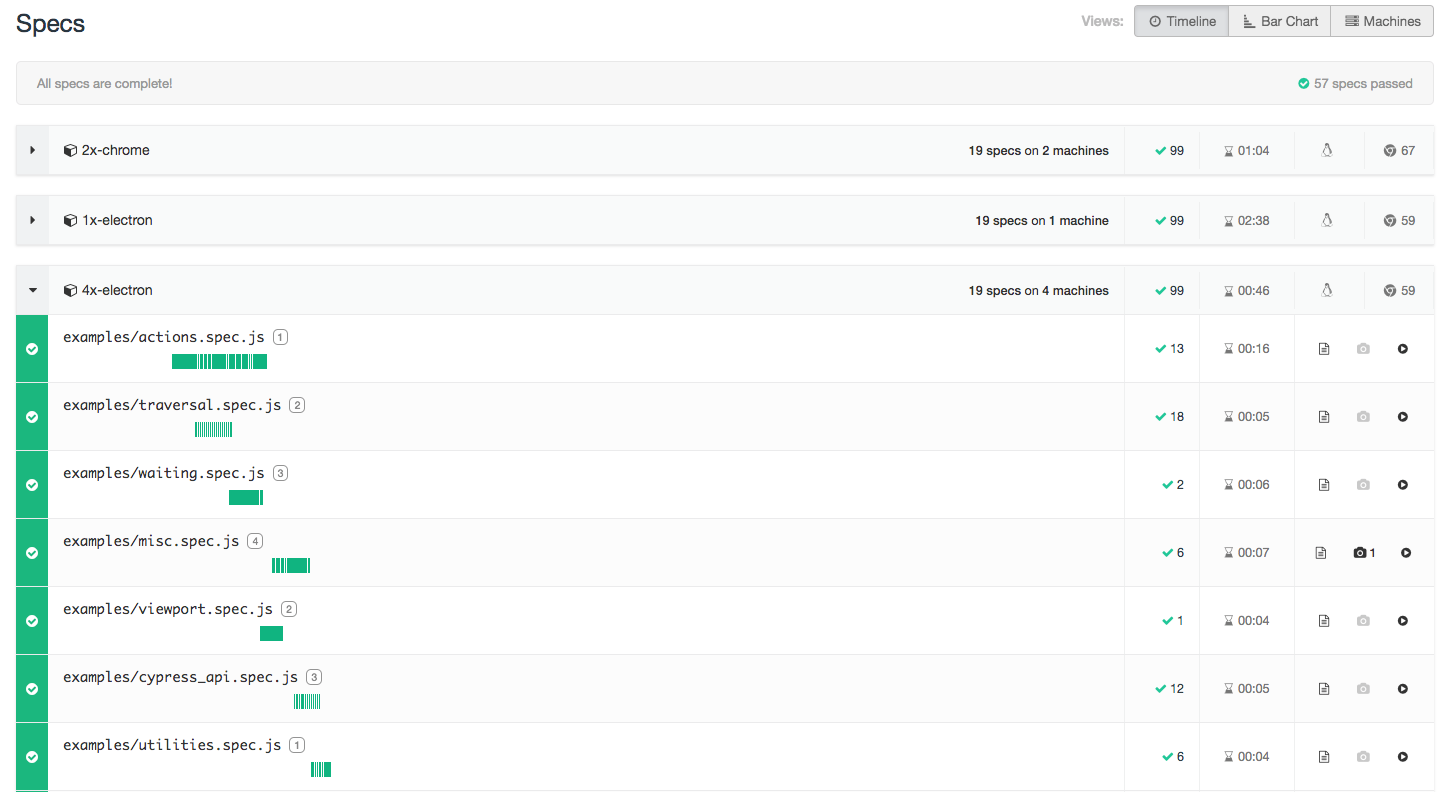
Notice right away that in addition to parallelization, we have another feature - grouping of runs. Previously, there was no way to join multiple cypress run --record results together; each command created a separate Dashboard record. Now you can slice and dice tests and still record them as a single logical run. In the above case there were 3 groups created using the following commands:
cypress run --record --group 1x-electron
cypress run --record --group 2x-chrome --parallel --browser chrome
cypress run --record --group 4x-electron --parallel
The first group 1x-electron did not load balance tests and ran all specs on a single machine. The second group 2x-chrome split all tests across 2 machines and executed them in Chrome browser. Finally the last group used 4 CI machines to load balance all 19 spec files. The above “Timeline” view shows the waterfall of specs - you can see when each spec started and finished, and the gaps between the specs were taken by video encoding and uploading.
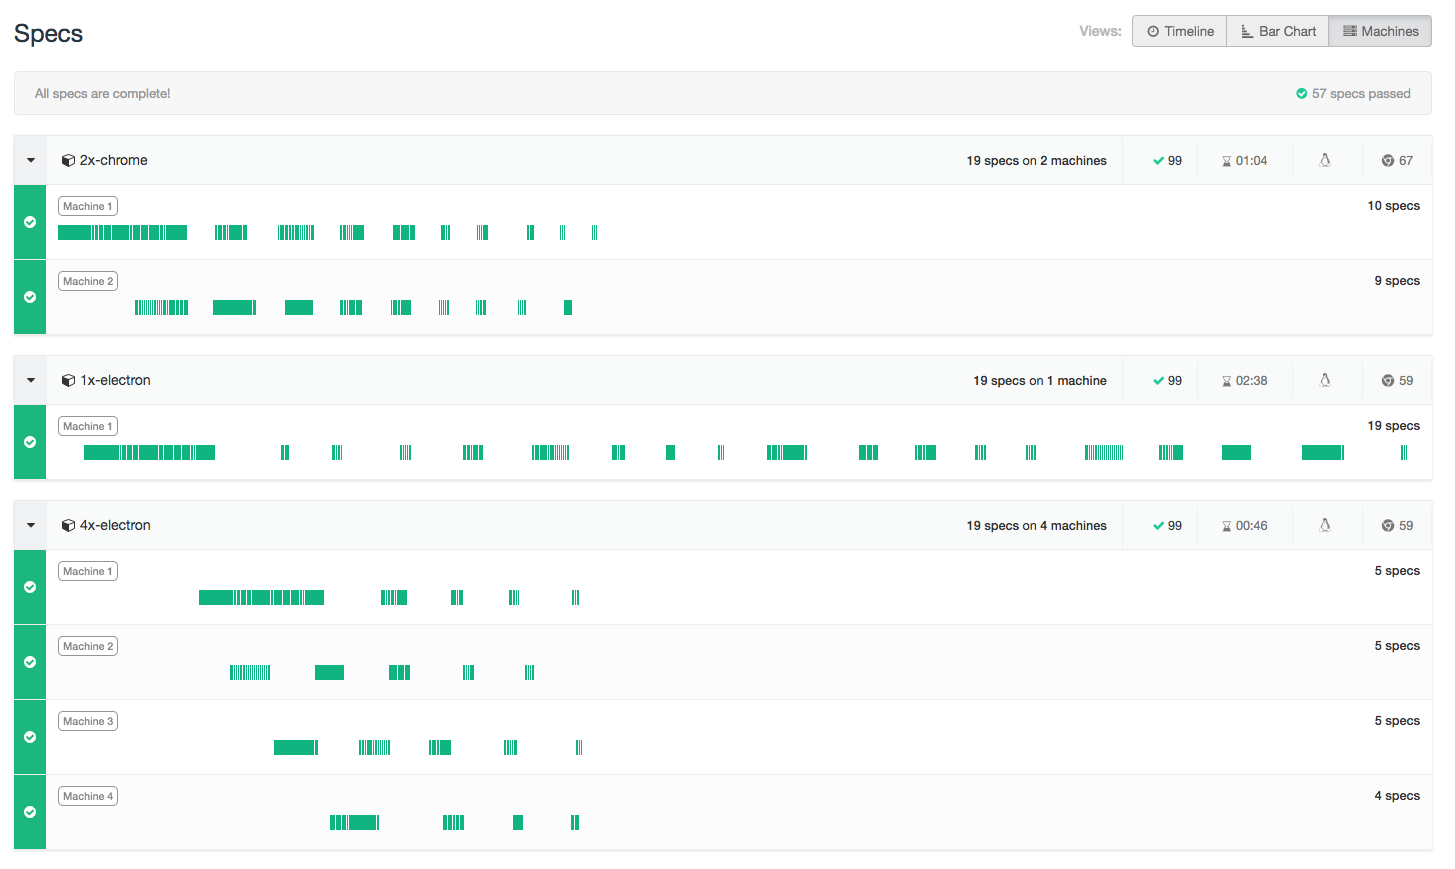
My favorite view is “Machines”. It shows how each CI machine was utilized during the run. You can see how longer running specs were executed first in parallelized groups (this is optimal when splitting the load), while non-parallelized group 1x-electron just ran the specs in the order they were found.

In this run, a single machine in group 1x-electron was just chugging along, executing each spec and finishing after 2 minutes and 38 seconds. Two machines in group 2x-chrome quickly finished half of specs each (10 and 9 to be precise) in 1 minute and 4 seconds. Why wasn’t the group 4x-electron faster? It had 4 machines, but finished in 46 seconds, not much faster than two machines running Chrome browser. There are two reasons for this
- Chrome is just a faster browser than Electron
- Each spec has overhead: encoding and upload artifacts and coordination with the service. For such tiny spec files the overhead becomes very significant. In a more realistic scenarios, the results will be more … balanced.
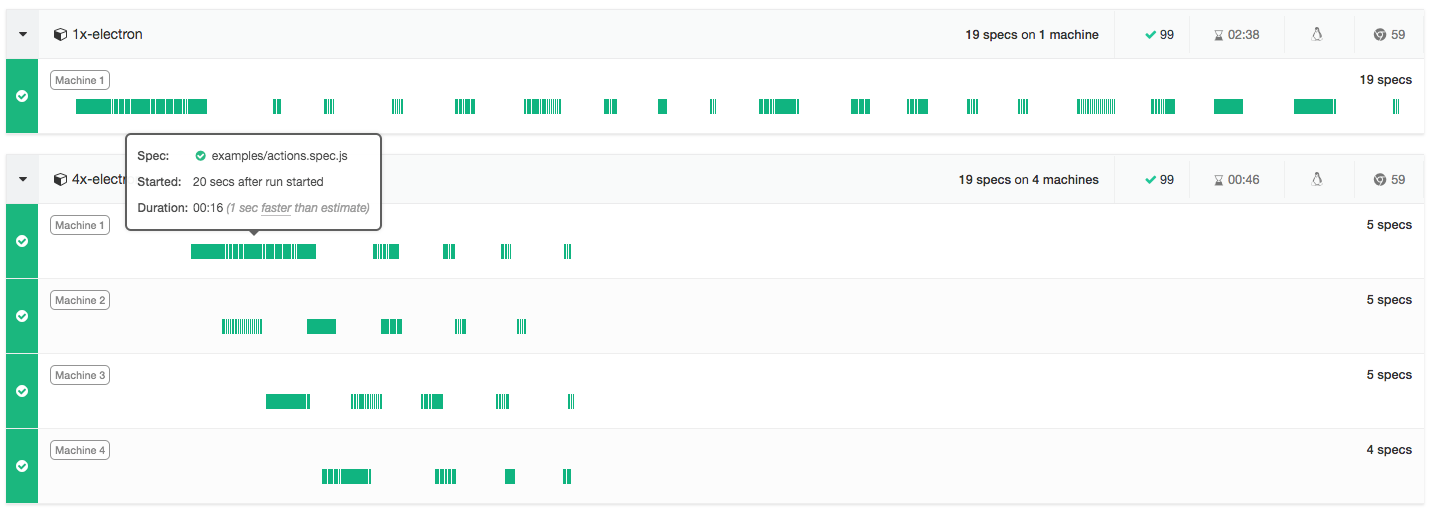
The combined machines view also shows when each spec starts with respect to the very first spec of the run. Just hover over a spec bar to see insights into its timing.

In this run, Circle “gave” us 4 machines for group 4x-electron slightly later than machines for other groups, which explains the initial gap. We are currently working on more ways to show useful insights into the run time data. For example we can accurately calculate the expected run time if you allocate more or fewer CI machines. Stay tuned by following @cypress_io and our dev team members.
More information
- Parallelization documentation
- cypress-example-kitchensink repo has parallelization set up for CircleCI, Travis and GitLab
- cypress-example-docker-codeship has parallelization set up for Codeship Pro
- ask questions on our https://gitter.im/cypress-io/cypress channel and use GitHub issues to report any unexpected behavior
